OCR · GCSE · Biology
Course version: J247 · Version from Sept 2018
Extract and interpret information from charts, graphs and tables
Full specification wording
Inheritance: extract and interpret information from charts, graphs and tables
Genetic data is routinely communicated through pedigree family trees, phenotype frequency tables, and variation graphs.
- Point 3 of 16
- 3 key terms
Study notes
From the teaching notes for this specification point.
The idea
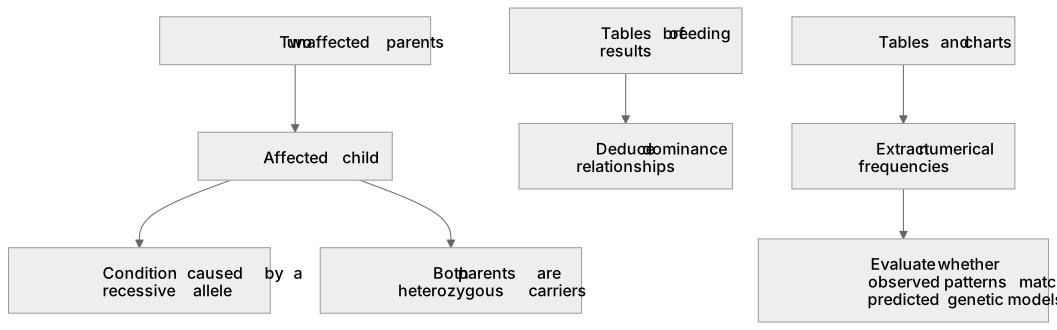
Genetic data is routinely communicated through pedigree family trees, phenotype frequency tables, and variation graphs. Interpreting pedigree charts requires students to trace inheritance through shaded and unshaded symbols across numbered generations. A key diagnostic skill is identifying two unaffected parents who produce an affected child, which proves definitively that the condition is caused by a recessive allele and that both parents are heterozygous carriers. Tables of breeding results allow deduction of dominance relationships.
What earns the marks
- Deduce genotypes of individuals in a pedigree chart by tracing ancestral and descendant phenotypes.
- Identify two unaffected parents with an affected offspring as definitive evidence of a recessive allele.
- Extract numerical frequencies from tables to evaluate whether observed patterns match predicted genetic models.
Common mistakes and how to put them right
Assuming an allele is dominant simply because it is common within the family pedigree shown.
Misreading pedigree generation Roman numerals or birth order numbering when identifying specific individuals.
Exam tips
- When asked to explain how a pedigree proves an allele is recessive, cite specific numbered individuals, noting unaffected parents having an affected child.
- Label known genotypes directly onto the pedigree diagram during the exam to keep track of alleles.
Try the lesson
The start of the Inheritance: extract and interpret information from charts, graphs and tables lesson, made from teaching notes for this specification point.
Have a go first
A table shows the number of pea plants with purple flowers and with white flowers in a field. There are 120 purple-flowered plants and 80 white-flowered plants. How many plants are there in total?
Listen
Genetic data is routinely communicated through pedigree family trees, phenotype frequency tables, and variation graphs. Interpreting pedigree charts requires students to trace inheritance through shaded and unshaded symbols across numbered generations. A key diagnostic skill is identifying two unaffected parents who produce an affected child, which proves definitively that the condition is caused by a recessive allele and that both parents are heterozygous carriers. Tables of breeding results allow deduction of dominance relationships. A strong answer earns marks for these points. Deduce genotypes of individuals in a pedigree chart by tracing ancestral and descendant phenotypes. Identify two unaffected parents with an affected offspring as definitive evidence of a recessive allele. Extract numerical frequencies from tables to evaluate whether observed patterns match predicted genetic models. Exam tip: When asked to explain how a pedigree proves an allele is recessive, cite specific numbered individuals, noting unaffected parents having an affected child.
See it
Key words
Say what each word means before you turn the card.
pedigree charts
Try answering aloud or in your head before turning the card.
carrier identification
Try answering aloud or in your head before turning the card.
data interpretation
Try answering aloud or in your head before turning the card.
See every definition
- pedigree charts
- Charts that show inheritance traced through shaded and unshaded symbols across numbered generations.
- carrier identification
- Identifying two unaffected parents who produce an affected child, proving both are heterozygous carriers of a recessive allele.
- data interpretation
- Extracting numerical frequencies from tables to evaluate whether observed patterns match predicted genetic models.
Label the diagram
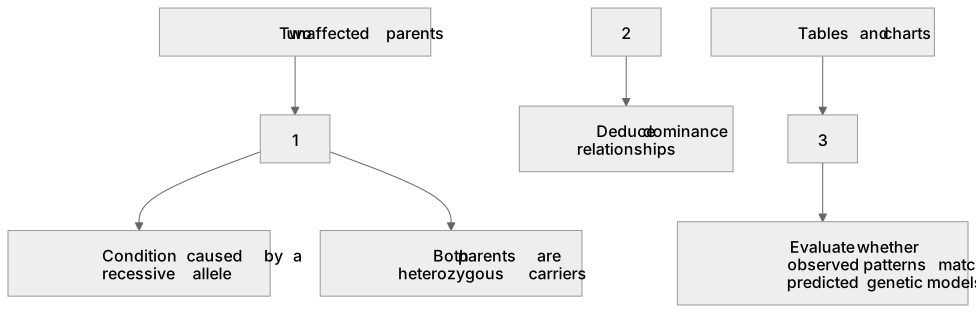
Some boxes have lost their names. Pick the right name for each number.
1Box 1
2Box 2
3Box 3
There is more to this lesson
The full lesson goes on to check your understanding and help you earn the marks. Create a free account to carry on, with your progress saved.
A week of Premium from your first lesson · Then the free plan continues · No card, no charge
Test your understanding of Inheritance: extract and interpret information from charts, graphs and tables
Active recall beats re-reading. Take an instant quiz now to test what you’ve learned and lock it into long-term memory.
A week of Premium from your first lesson · Then the free plan continues · No card, no charge