OCR · GCSE · Biology
Course version: J247 · Version from Sept 2018
Extract and interpret data from graphs, charts and tables
Full specification wording
Maintaining internal environments: extract and interpret data from graphs, charts and tables
Homeostatic regulation relies on monitoring physiological variables through clinical and experimental data.
- Point 1 of 11
- 3 key terms
Study notes
From the teaching notes for this specification point.
The idea
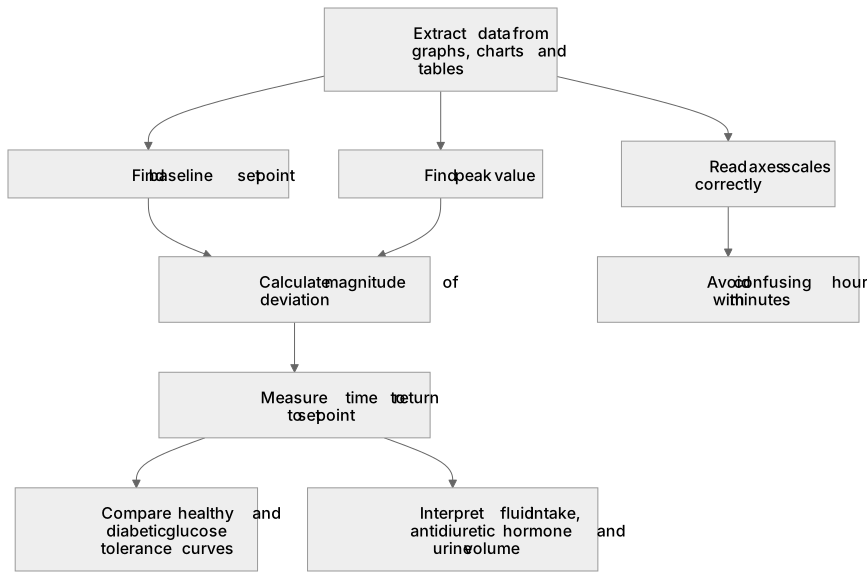
Homeostatic regulation relies on monitoring physiological variables through clinical and experimental data. Learners examine graphs depicting core body temperature fluctuations during thermoregulation, blood glucose concentrations during oral glucose tolerance tests, and variations in plasma antidiuretic hormone levels alongside urine volume and concentration. Interpreting these datasets involves determining baseline set points, calculating the magnitude of deviations following physiological challenges (such as exercise, eating, or water ingestion), and measuring the time required for negative feedback mechanisms to restore normal physiological homeostatic equilibrium.
What earns the marks
- Extract baseline and peak values accurately from homeostatic graphs and tables.
- Calculate the time taken for blood glucose or core body temperature to return to set point following a challenge.
- Compare physiological responses between healthy individuals and diabetic patients using glucose tolerance curves.
- Interpret relationships between fluid intake, plasma antidiuretic hormone concentration, and urine volume.
Common mistakes and how to put them right
Misreading axes scales or confusing hours with minutes on glucose tolerance test graphs.
Describing only the peak value while omitting the subsequent return to normal baseline levels.
Failing to explain the underlying biological mechanism when asked to interpret the trend.
Exam tips
- In questions about glucose tolerance curves, always state both the peak glucose concentration and how long it took to return to resting baseline.
- Remember that a diabetic patient typically exhibits a higher peak glucose level that remains elevated for a significantly longer duration.
Try the lesson
The start of the Maintaining internal environments: extract and interpret data from graphs, charts and tables lesson, made from teaching notes for this specification point.
Have a go first
A table shows the body temperature of a person measured every hour. At 09:00 the temperature is 36.8 °C and at 10:00 it is 37.0 °C. By how many degrees Celsius did the temperature rise between 09:00 and 10:00?
Listen
Homeostatic regulation relies on monitoring physiological variables through clinical and experimental data. Learners examine graphs depicting core body temperature fluctuations during thermoregulation, blood glucose concentrations during oral glucose tolerance tests, and variations in plasma antidiuretic hormone levels alongside urine volume and concentration. Interpreting these datasets involves determining baseline set points, calculating the magnitude of deviations following physiological challenges (such as exercise, eating, or water ingestion), and measuring the time required for negative feedback mechanisms to restore normal physiological homeostatic equilibrium. A strong answer earns marks for these points. extract baseline and peak values accurately from homeostatic graphs and tables. calculate the time taken for blood glucose or core body temperature to return to set point following a challenge. compare physiological responses between healthy individuals and diabetic patients using glucose tolerance curves. interpret relationships between fluid intake, plasma antidiuretic hormone concentration, and urine volume. Exam tip: In questions about glucose tolerance curves, always state both the peak glucose concentration and how long it took to return to resting baseline.
See it
Key words
Say what each word means before you turn the card.
thermoregulatory curves
Try answering aloud or in your head before turning the card.
negative feedback graphs
Try answering aloud or in your head before turning the card.
homeostatic data
Try answering aloud or in your head before turning the card.
See every definition
- thermoregulatory curves
- Graphs depicting core body temperature fluctuations during thermoregulation, from which baseline and peak values can be extracted.
- negative feedback graphs
- Graphs from which the time required for negative feedback mechanisms to restore normal physiological homeostatic equilibrium can be measured.
- homeostatic data
- Data from graphs, charts and tables showing physiological variables, from which baseline set points and the magnitude of deviations following challenges can be determined.
Label the diagram
Some boxes have lost their names. Pick the right name for each number.
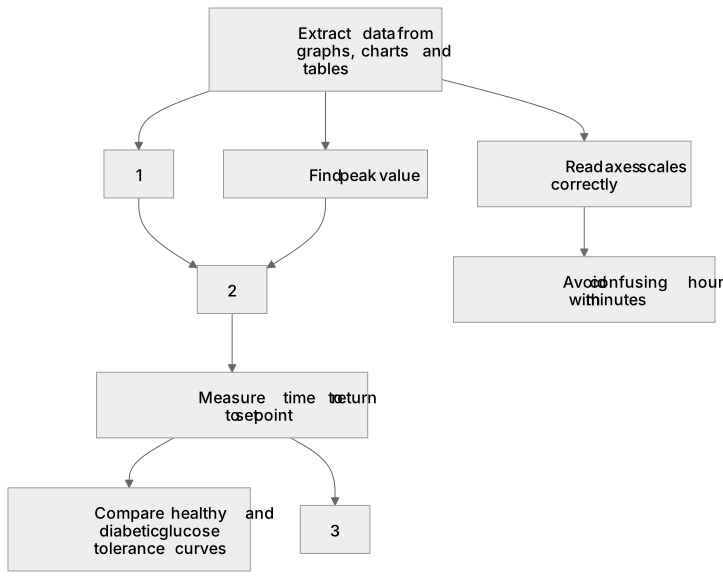
1Box 1
2Box 2
3Box 3
There is more to this lesson
The full lesson goes on to check your understanding and help you earn the marks. Create a free account to carry on, with your progress saved.
A week of Premium from your first lesson · Then the free plan continues · No card, no charge
Test your understanding of Maintaining internal environments: extract and interpret data from graphs, charts and tables
Active recall beats re-reading. Take an instant quiz now to test what you’ve learned and lock it into long-term memory.
A week of Premium from your first lesson · Then the free plan continues · No card, no charge