OCR · GCSE · Biology
Course version: J247 · Version from Sept 2018
Translate information between graphical and numerical forms
Full specification wording
Monitoring and maintaining health: translate information between graphical and numerical forms
Medical and public health data requires translating complex information between graphical plots and numerical values.
- Point 1 of 29
- 4 key terms
Study notes
From the teaching notes for this specification point.
The idea
Medical and public health data requires translating complex information between graphical plots and numerical values. In cardiovascular health, learners translate blood pressure measurements and body mass index charts into quantitative risk categorisations, evaluating physiological status and identifying underlying non-communicable disease risk factors.
What earns the marks
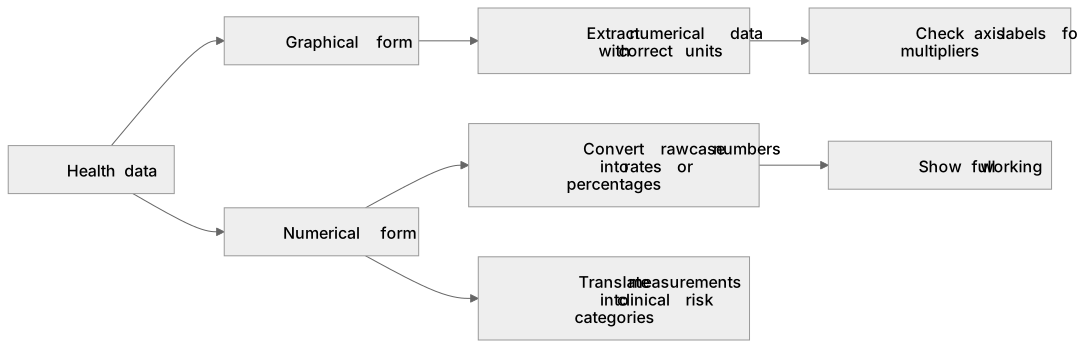
- Extract numerical data from health and epidemiological graphs with correct units.
- Convert raw medical case numbers into standardized rates, such as cases per 100,000 people or percentages.
- Translate physiological measurements like blood pressure or body mass index into clinical risk categories.
Common mistakes and how to put them right
Misreading axes when values are plotted per 100,000 population, treating them as simple raw headcounts.
Failing to calculate percentage changes between baseline and elevated disease risk levels.
Exam tips
- Check axis labels for multipliers such as in thousands or rate per 100,000 before recording numerical answers.
- Show full working when calculating disease incidence rates or converting raw counts into percentages.
Try the lesson
The start of the Monitoring and maintaining health: translate information between graphical and numerical forms lesson, made from teaching notes for this specification point.
Have a go first
The bar chart shows the number of cases of measles recorded in a town over four months.
Chart Title: Measles Cases Y-axis (Number of Cases): 0, 5, 10, 15, 20, 25 X-axis (Month): Jan, Feb, Mar, Apr Bar heights: Jan=15, Feb=25, Mar=10, Apr=20
How many cases of measles were recorded in February?
Listen
Medical and public health data requires translating complex information between graphical plots and numerical values. In cardiovascular health, learners translate blood pressure measurements and body mass index charts into quantitative risk categorisations, evaluating physiological status and identifying underlying non-communicable disease risk factors. A strong answer earns marks for these points. Extract numerical data from health and epidemiological graphs with correct units. Convert raw medical case numbers into standardized rates, such as cases per 100,000 people or percentages. Translate physiological measurements like blood pressure or body mass index into clinical risk categories. Exam tip: Check axis labels for multipliers such as in thousands or rate per 100,000 before recording numerical answers.
See it
Key words
Say what each word means before you turn the card.
health data translation
Try answering aloud or in your head before turning the card.
epidemiological rates
Try answering aloud or in your head before turning the card.
disease prevalence
Try answering aloud or in your head before turning the card.
clinical risk factors
Try answering aloud or in your head before turning the card.
See every definition
- health data translation
- Translating complex information between graphical plots and numerical values, such as extracting mortality or infection statistics from epidemiological graphs.
- epidemiological rates
- Standardized rates converted from raw medical case numbers, such as cases per 100,000 people or percentages.
- disease prevalence
- Figures that can be converted into percentages or rates per 100,000 population.
- clinical risk factors
- Underlying non-communicable disease risk factors identified by translating physiological measurements into quantitative risk categorisations.
Label the diagram
Some boxes have lost their names. Pick the right name for each number.
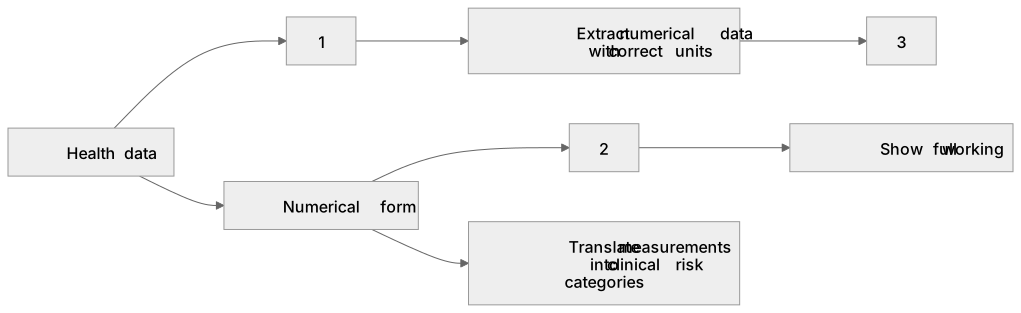
1Box 1
2Box 2
3Box 3
There is more to this lesson
The full lesson goes on to check your understanding and help you earn the marks. Create a free account to carry on, with your progress saved.
A week of Premium from your first lesson · Then the free plan continues · No card, no charge
Test your understanding of Monitoring and maintaining health: translate information between graphical and numerical forms
Active recall beats re-reading. Take an instant quiz now to test what you’ve learned and lock it into long-term memory.
A week of Premium from your first lesson · Then the free plan continues · No card, no charge