OCR · GCSE · Biology
Course version: J247 · Version from Sept 2018
Construct and interpret frequency tables and diagrams, bar charts and…
Full specification wording
Monitoring and maintaining health: construct and interpret frequency tables and diagrams, bar charts and histograms
Epidemiological and physiological data must be displayed using correct graphical formats.
- Point 2 of 29
- 4 key terms
Study notes
From the teaching notes for this specification point.
The idea
Epidemiological and physiological data must be displayed using correct graphical formats. Frequency tables organize clinical observations into discrete or continuous categories. Bar charts display categorical, discontinuous health data (such as rates of bacterial versus viral infections or blood groups), with distinct gaps between bars. In contrast, histograms represent continuous variables (such as patient age distributions, resting heart rates, or blood cholesterol levels), where bars touch and the area under the bar reflects frequency density across class intervals.
What earns the marks
- Construct and read frequency tables grouping clinical health data into appropriate class intervals.
- Draw bar charts with spaces between bars for discontinuous, categorical medical variables.
- Draw and interpret histograms with touching bars representing continuous physiological variables like age or blood pressure.
Common mistakes and how to put them right
Drawing touching bars for categorical data like blood groups, incorrectly treating it as continuous data.
Leaving irregular gaps between bars on a bar chart or failing to label class widths on a histogram.
Exam tips
- Remember: discrete categories like pathogen type need separate bars with gaps; continuous measurements like mass or age touch.
- Ensure frequency scales start at zero unless a clear break in the axis is explicitly indicated.
Try the lesson
The start of the Monitoring and maintaining health: construct and interpret frequency tables and diagrams, bar charts and histograms lesson, made from teaching notes for this specification point.
Have a go first
A frequency table shows blood groups: A 12, B 5, AB 3 and O 20. What is the total number of people recorded?
Listen
Epidemiological and physiological data must be displayed using correct graphical formats. Frequency tables organize clinical observations into discrete or continuous categories. Bar charts display categorical, discontinuous health data (such as rates of bacterial versus viral infections or blood groups), with distinct gaps between bars. In contrast, histograms represent continuous variables (such as patient age distributions, resting heart rates, or blood cholesterol levels), where bars touch and the area under the bar reflects frequency density across class intervals. A strong answer earns marks for these points. Construct and read frequency tables grouping clinical health data into appropriate class intervals. Draw bar charts with spaces between bars for discontinuous, categorical medical variables. Draw and interpret histograms with touching bars representing continuous physiological variables like age or blood pressure. Exam tip: Remember: discrete categories like pathogen type need separate bars with gaps; continuous measurements like mass or age touch.
See it
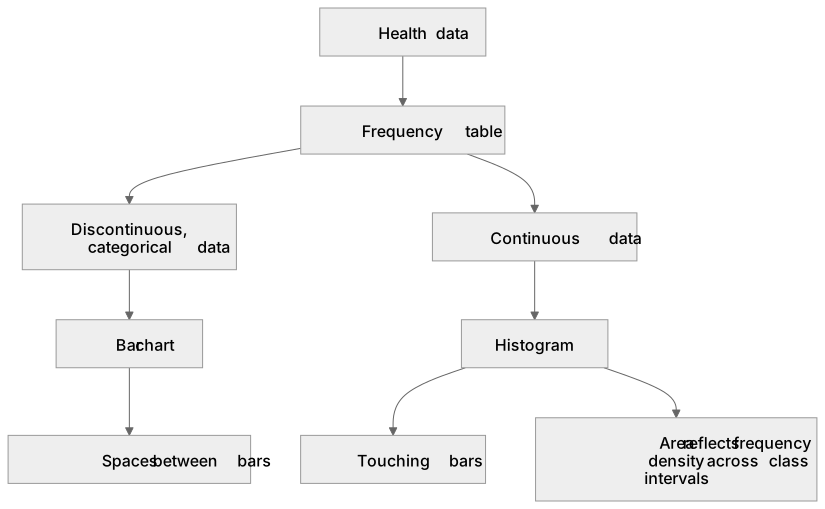
Key words
Say what each word means before you turn the card.
frequency tables
Try answering aloud or in your head before turning the card.
bar charts
Try answering aloud or in your head before turning the card.
histograms
Try answering aloud or in your head before turning the card.
continuous physiological variables
Try answering aloud or in your head before turning the card.
See every definition
- frequency tables
- Organise clinical observations into discrete or continuous categories, grouping clinical health data into appropriate class intervals.
- bar charts
- Display categorical, discontinuous health data with distinct gaps between bars, for example rates of bacterial versus viral infections or blood groups.
- histograms
- Represent continuous variables such as patient age distributions, resting heart rates or blood cholesterol levels, where bars touch and the area under the bar reflects frequency density across class intervals.
- continuous physiological variables
- Variables such as age or blood pressure that are represented by histograms with touching bars.
Label the diagram
Some boxes have lost their names. Pick the right name for each number.
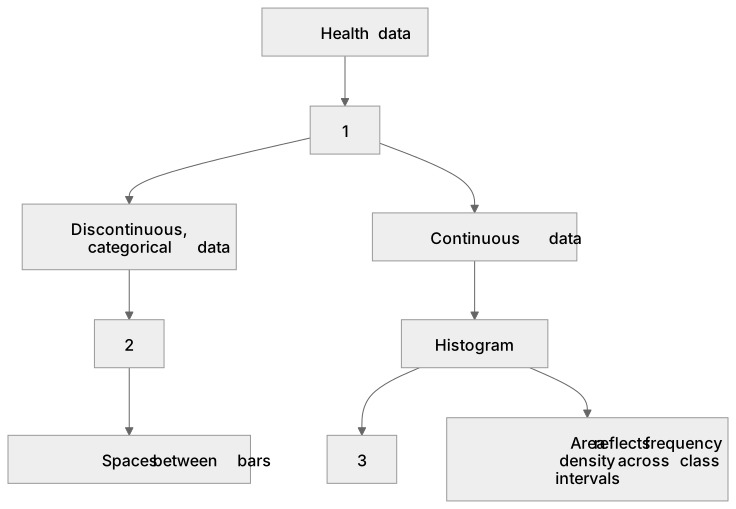
1Box 1
2Box 2
3Box 3
There is more to this lesson
The full lesson goes on to check your understanding and help you earn the marks. Create a free account to carry on, with your progress saved.
A week of Premium from your first lesson · Then the free plan continues · No card, no charge
Test your understanding of Monitoring and maintaining health: construct and interpret frequency tables and diagrams, bar charts and histograms
Active recall beats re-reading. Take an instant quiz now to test what you’ve learned and lock it into long-term memory.
A week of Premium from your first lesson · Then the free plan continues · No card, no charge