OCR · GCSE · Biology
Course version: J247 · Version from Sept 2018
Application of appropriate sampling techniques to investigate the…
Full specification wording
Sampling techniques: Application of appropriate sampling techniques to investigate the distribution and abundance of organisms in an ecosystem via direct use in the field (to include: biotic and abiotic factors)
Ecological field sampling quantifies organism abundance and spatial distribution across habitats.
- Point 1 of 2
- 3 key terms
Study notes
From the teaching notes for this specification point.
The idea
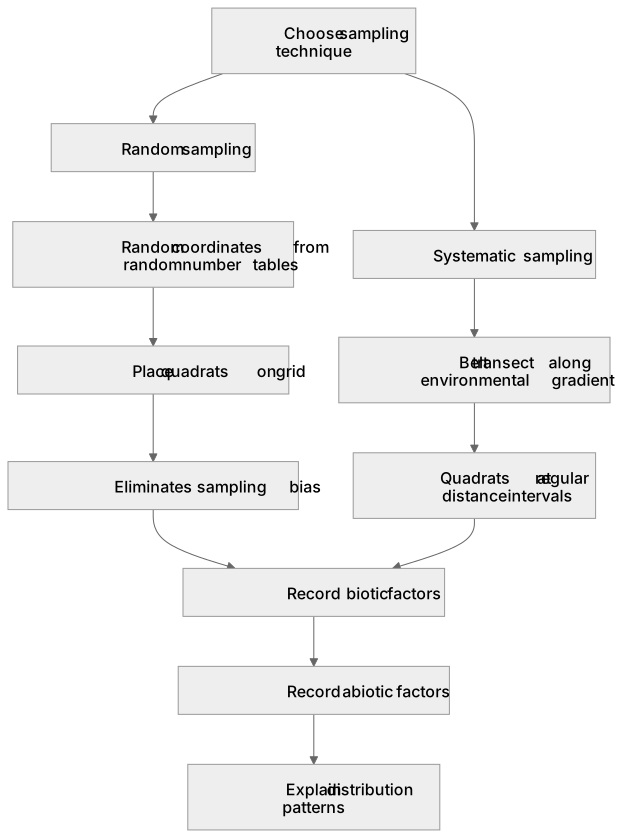
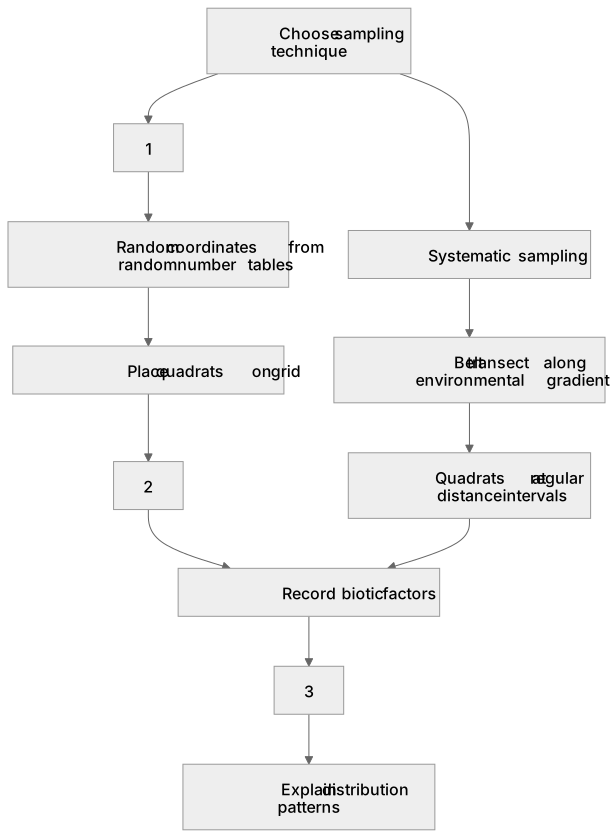
Ecological field sampling quantifies organism abundance and spatial distribution across habitats. Random sampling uses quadrat frames (e.g. 0.5 m by 0.5 m) placed at coordinates generated from random number tables across a measured grid, removing investigator bias when estimating population sizes of sessile organisms. Systematic sampling utilizes line or belt transects laid across an environmental gradient (such as from a shaded woodland into an open meadow) to record changes in species presence and percentage cover at regular intervals. At each sampling station, biotic influences (such as grazing pressure or plant competition) and abiotic gradients (such as light intensity and soil moisture) are recorded to explain distribution patterns.
What earns the marks
- Employ random coordinates generated from random number tables to position quadrats on a grid, eliminating sampling bias.
- Lay a belt transect along an environmental gradient to sample organism distribution systematically at regular distance intervals.
- Measure biotic factors (such as plant cover and competition) alongside abiotic factors (such as light intensity, soil pH, and soil moisture).
- Calculate total population size by multiplying mean count per quadrat by total habitat area divided by quadrat area.
Common mistakes and how to put them right
Throwing quadrats haphazardly or deliberately placing them where plants look abundant, introducing severe sampling bias.
Using random sampling instead of systematic transects when investigating changes across an environmental gradient.
Confusing organism abundance (total count in an area) with species distribution (where organisms are located across space).
Exam tips
- If asked how to sample across a gradient like trampling, shade, or shore height, always specify a transect with quadrats placed at regular intervals.
- When asked to calculate total population from quadrat data, write out the formula: (total area / sampled area) × total counted organisms.
Try the lesson
The start of the Sampling techniques: Application of appropriate sampling techniques to investigate the distribution and abundance of organisms in an ecosystem via direct use in the field (to include: biotic and abiotic factors) lesson, made from teaching notes for this specification point.
Have a go first
Which piece of equipment is a square frame used to define a specific area for sampling the abundance of plants?
Listen
Ecological field sampling quantifies organism abundance and spatial distribution across habitats. Random sampling uses quadrat frames (e.g. 0.5 m by 0.5 m) placed at coordinates generated from random number tables across a measured grid, removing investigator bias when estimating population sizes of sessile organisms. Systematic sampling utilizes line or belt transects laid across an environmental gradient (such as from a shaded woodland into an open meadow) to record changes in species presence and percentage cover at regular intervals. At each sampling station, biotic influences (such as grazing pressure or plant competition) and abiotic gradients (such as light intensity and soil moisture) are recorded to explain distribution patterns. A strong answer earns marks for these points. Employ random coordinates generated from random number tables to position quadrats on a grid, eliminating sampling bias. Lay a belt transect along an environmental gradient to sample organism distribution systematically at regular distance intervals. Measure biotic factors (such as plant cover and competition) alongside abiotic factors (such as light intensity, soil pH, and soil moisture). Calculate total population size by multiplying mean count per quadrat by total habitat area divided by quadrat area. Exam tip: If asked how to sample across a gradient like trampling, shade, or shore height, always specify a transect with quadrats placed at regular intervals.
See it
Key words
Say what each word means before you turn the card.
quadrat and transect methodology
Try answering aloud or in your head before turning the card.
abiotic and biotic correlations
Try answering aloud or in your head before turning the card.
population size estimation
Try answering aloud or in your head before turning the card.
See every definition
- quadrat and transect methodology
- Quadrat frames placed at random coordinates estimate population sizes of sessile organisms, while line or belt transects laid across an environmental gradient record changes in species presence and percentage cover at regular intervals.
- abiotic and biotic correlations
- Biotic influences such as grazing pressure or plant competition and abiotic gradients such as light intensity and soil moisture are recorded at each sampling station to explain distribution patterns.
- population size estimation
- Total population size is calculated by multiplying mean count per quadrat by total habitat area divided by quadrat area.
Label the diagram
Some boxes have lost their names. Pick the right name for each number.
1Box 1
2Box 2
3Box 3
There is more to this lesson
The full lesson goes on to check your understanding and help you earn the marks. Create a free account to carry on, with your progress saved.
A week of Premium from your first lesson · Then the free plan continues · No card, no charge
Test your understanding of Sampling techniques: Application of appropriate sampling techniques to investigate the distribution and abundance of organisms in an ecosystem via direct use in the field (to include: biotic and abiotic factors)
Active recall beats re-reading. Take an instant quiz now to test what you’ve learned and lock it into long-term memory.
A week of Premium from your first lesson · Then the free plan continues · No card, no charge