AQA · A-Level · Business
Course version: 7132 · Version from Sept 2023
The use of data for financial decision making and planning
Full specification wording
Analysing financial performance: The use of data for financial decision making and planning
Every tool in this part of the course runs on numbers that somebody had to produce, so the quality of any decision is capped by the quality of what it was built on.
- Point 8 of 8
- 4 key terms
Study notes
From the teaching notes for this specification point.
The idea
Every tool in this part of the course runs on numbers that somebody had to produce, so the quality of any decision is capped by the quality of what it was built on. Published accounts are reliable but backward looking; the sales forecast is what a plan really rests on and is usually the least dependable line in it, because behind it sit a sample, a method and sometimes an optimistic owner. The habit worth teaching is to ask who produced a figure, how old it is, whether it is a recorded fact or an estimate, and how far the conclusion moves if the estimate is wrong by a tenth, which is sensitivity analysis in all but name. Qualitative information still counts: a supplier reputation or the mood of one large customer never appears in the spreadsheet and can overturn what the spreadsheet recommends.
What earns the marks
- Naming the source of the figure used and questioning its reliability, rather than accepting everything printed in the extract as fact.
- Separating recorded history, such as last year accounts, from estimates of the future, such as projected sales or expected savings.
- Testing how sensitive the conclusion is, for example showing that payback stretches past the useful life of the machine if sales come in a tenth below forecast.
- Bringing in a relevant qualitative factor the data does not capture, such as staff morale, brand reputation or the owner attitude to risk.
- Building the final judgement on the strongest evidence available and saying explicitly what extra information would settle it.
Common mistakes and how to put them right
Treating every figure in the case study as certain, particularly forecast sales, which are the most doubtful numbers on the page.
Rejecting the data wholesale with a line about all forecasts being wrong, instead of naming the one figure that looks shaky and saying why.
Assuming more data is automatically better, ignoring what it costs to collect and how long the decision then waits.
Quoting a figure from the extract without doing anything with it, which reads as description rather than analysis.
Exam tips
- This idea is the evaluation half of nearly every finance question, so keep one line ready: the numbers point one way, but they rest on an estimate that could reasonably be wrong.
- Say how confident you are and why, since examiners reward a judgement that shows awareness of the limits of its own evidence.
- Where the extract gives two years of data only, say so, because a trend drawn from two points is a weak foundation for a large commitment.
Try the lesson
The start of the Analysing financial performance: The use of data for financial decision making and planning lesson, made from teaching notes for this specification point.
Have a go first
A business has budgeted sales revenue of £80,000 for the coming year. What is the main purpose of comparing this budgeted figure with actual sales revenue during the year?
Listen
Every tool in this part of the course runs on numbers that somebody had to produce, so the quality of any decision is capped by the quality of what it was built on. Published accounts are reliable but backward looking; the sales forecast is what a plan really rests on and is usually the least dependable line in it, because behind it sit a sample, a method and sometimes an optimistic owner. The habit worth teaching is to ask who produced a figure, how old it is, whether it is a recorded fact or an estimate, and how far the conclusion moves if the estimate is wrong by a tenth, which is sensitivity analysis in all but name. Qualitative information still counts: a supplier reputation or the mood of one large customer never appears in the spreadsheet and can overturn what the spreadsheet recommends. A strong answer earns marks for these points. Naming the source of the figure used and questioning its reliability, rather than accepting everything printed in the extract as fact. Separating recorded history, such as last year accounts, from estimates of the future, such as projected sales or expected savings. Testing how sensitive the conclusion is, for example showing that payback stretches past the useful life of the machine if sales come in a tenth below forecast. Bringing in a relevant qualitative factor the data does not capture, such as staff morale, brand reputation or the owner attitude to risk. Exam tip: This idea is the evaluation half of nearly every finance question, so keep one line ready: the numbers point one way, but they rest on an estimate that could reasonably be wrong.
See it
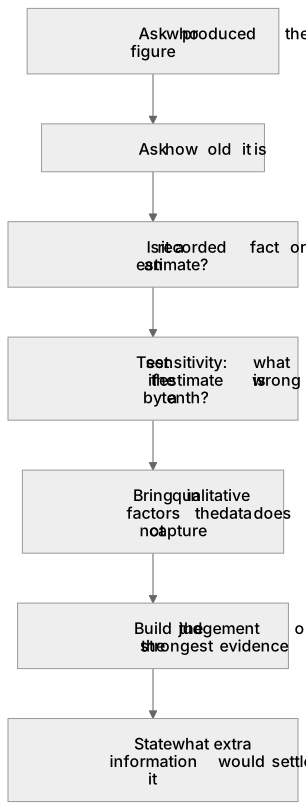
Put it in order
Put these steps in the order they happen.
- 1. State what extra information would settle it
- 2. Build the judgement on the strongest evidence
- 3. Is it a recorded fact or an estimate?
- 4. Bring in qualitative factors the data does not capture
- 5. Ask who produced the figure
- 6. Ask how old it is
- 7. Test sensitivity: what if the estimate is wrong by a tenth?
Key words
Say what each word means before you turn the card.
data reliability
Try answering aloud or in your head before turning the card.
forecast risk
Try answering aloud or in your head before turning the card.
sensitivity analysis
Try answering aloud or in your head before turning the card.
qualitative factors
Try answering aloud or in your head before turning the card.
See every definition
- data reliability
- The quality of the numbers a decision is built on, which caps the quality of that decision; the habit is to ask who produced a figure and how old it is.
- forecast risk
- The sales forecast is what a plan really rests on and is usually the least dependable line in it, because behind it sit a sample, a method and sometimes an optimistic owner.
- sensitivity analysis
- Testing how far the conclusion moves if the estimate is wrong by a tenth, for example showing that payback stretches past the useful life of the machine.
- qualitative factors
- Information such as a supplier reputation or the mood of one large customer that never appears in the spreadsheet and can overturn what the spreadsheet recommends.
Label the diagram
Some boxes have lost their names. Pick the right name for each number.
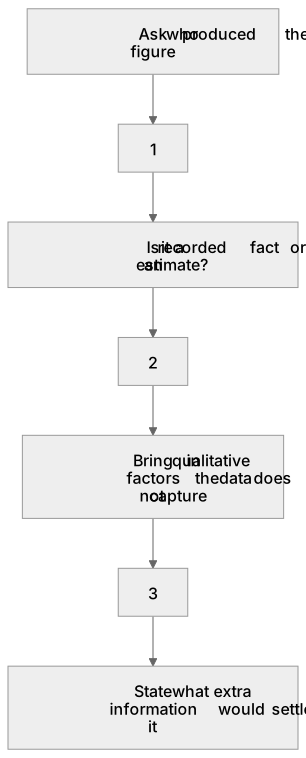
1Box 1
2Box 2
3Box 3
There is more to this lesson
The full lesson goes on to check your understanding and help you earn the marks. Create a free account to carry on, with your progress saved.
A week of Premium from your first lesson · Then the free plan continues · No card, no charge
Test your understanding of Analysing financial performance: The use of data for financial decision making and planning
Active recall beats re-reading. Take an instant quiz now to test what you’ve learned and lock it into long-term memory.
A week of Premium from your first lesson · Then the free plan continues · No card, no charge