AQA · A-Level · Business
Course version: 7132 · Version from Sept 2023
How to construct and interpret break-even charts (to include: Break-even…
Full specification wording
Analysing financial performance: How to construct and interpret break-even charts (to include: Break-even analysis should include: break-even output, margin of safety, contribution per unit, total contribution.)
Contribution per unit is selling price per unit less variable cost per unit, measured in pounds, and it is the money each sale leaves behind to put towards the fixed costs; multiply it by units…
- Point 3 of 8
- 4 key terms
Study notes
From the teaching notes for this specification point.
The idea
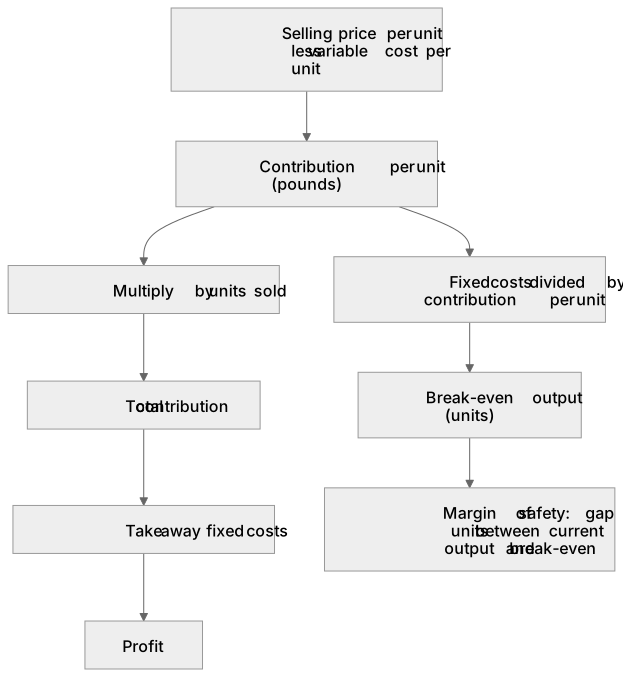
Contribution per unit is selling price per unit less variable cost per unit, measured in pounds, and it is the money each sale leaves behind to put towards the fixed costs; multiply it by units sold and you have total contribution, from which fixed costs are taken to give profit. Break-even output is fixed costs divided by contribution per unit and is measured in units, never in pounds, while margin of safety is the gap in units between current output and that break-even point, which tells a manager how far sales can fall before losses start. On the chart, output runs along the horizontal axis and pounds up the vertical; the fixed cost line is horizontal, the total cost line starts on the vertical axis level with fixed cost, the total revenue line starts at the origin, and break-even is where revenue crosses total cost.
What earns the marks
- Using the right formula and the right unit: contribution in pounds per unit, break-even in units, margin of safety in units.
- Labelling every line on the chart, with total revenue drawn from the origin and total cost drawn from the fixed cost level on the vertical axis.
- Marking the break-even point where total revenue crosses total cost and shading or arrowing the margin of safety across to current output.
- Reading the figures out of the case study rather than inventing round numbers, and stating the answer in context, for example how many covers a restaurant must serve each week.
- Interpreting margin of safety as a measure of risk for this business, not simply quoting it.
Common mistakes and how to put them right
Dividing fixed costs by selling price instead of by contribution per unit, which ignores the variable cost of every extra unit.
Put it right: Subtract variable cost per unit from price first.
Drawing the total cost line from the origin, which says the firm has no fixed costs at all.
Put it right: Start it on the vertical axis at the fixed cost level.
Confusing contribution with profit, when contribution only becomes profit once fixed costs are covered.
Put it right: State that profit equals total contribution minus fixed costs.
Giving break-even output as a sum of money, or rounding a part unit down when the firm must sell the whole unit to cover its costs.
Put it right: Round up to the next whole unit and label it in units.
Exam tips
- Break-even is a reliable short calculate question, so learn the formula well enough to write it before you look at the numbers.
- If the paper gives a partly drawn chart, add only the line asked for and label it; redrawing the whole chart wastes minutes you need for the longer answers.
- When asked to analyse, convert the number into a business consequence, such as the firm needing eight months of current demand just to cover fixed costs.
Try the lesson
The start of the Analysing financial performance: How to construct and interpret break-even charts (to include: Break-even analysis should include: break-even output, margin of safety, contribution per unit, total contribution.) lesson, made from teaching notes for this specification point.
Have a go first
A firm sells its product for £20 per unit. Variable cost per unit is £12. What is the contribution per unit?
Listen
Contribution per unit is selling price per unit less variable cost per unit, measured in pounds, and it is the money each sale leaves behind to put towards the fixed costs; multiply it by units sold and you have total contribution, from which fixed costs are taken to give profit. Break-even output is fixed costs divided by contribution per unit and is measured in units, never in pounds, while margin of safety is the gap in units between current output and that break-even point, which tells a manager how far sales can fall before losses start. On the chart, output runs along the horizontal axis and pounds up the vertical; the fixed cost line is horizontal, the total cost line starts on the vertical axis level with fixed cost, the total revenue line starts at the origin, and break-even is where revenue crosses total cost. A strong answer earns marks for these points. Using the right formula and the right unit: contribution in pounds per unit, break-even in units, margin of safety in units. Labelling every line on the chart, with total revenue drawn from the origin and total cost drawn from the fixed cost level on the vertical axis. Marking the break-even point where total revenue crosses total cost and shading or arrowing the margin of safety across to current output. Reading the figures out of the case study rather than inventing round numbers, and stating the answer in context, for example how many covers a restaurant must serve each week. A common slip: Dividing fixed costs by selling price instead of by contribution per unit, which ignores the variable cost of every extra unit. Instead, subtract variable cost per unit from price first. Exam tip: Break-even is a reliable short calculate question, so learn the formula well enough to write it before you look at the numbers.
See it
Key words
Say what each word means before you turn the card.
contribution per unit
Try answering aloud or in your head before turning the card.
break-even output
Try answering aloud or in your head before turning the card.
margin of safety
Try answering aloud or in your head before turning the card.
total contribution
Try answering aloud or in your head before turning the card.
See every definition
- contribution per unit
- Selling price per unit less variable cost per unit, measured in pounds, and the money each sale leaves behind to put towards the fixed costs.
- break-even output
- Fixed costs divided by contribution per unit, measured in units, never in pounds.
- margin of safety
- The gap in units between current output and the break-even point, which tells a manager how far sales can fall before losses start.
- total contribution
- Contribution per unit multiplied by units sold, from which fixed costs are taken to give profit.
Label the diagram
Some boxes have lost their names. Pick the right name for each number.
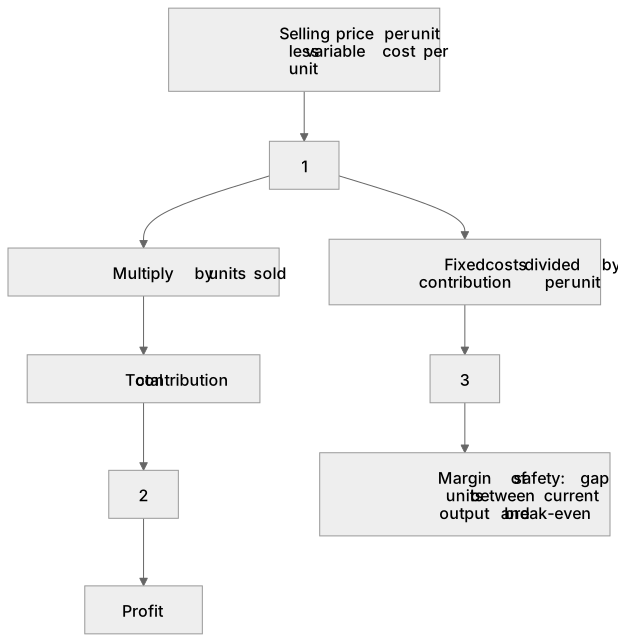
1Box 1
2Box 2
3Box 3
There is more to this lesson
The full lesson goes on to check your understanding and help you earn the marks. Create a free account to carry on, with your progress saved.
A week of Premium from your first lesson · Then the free plan continues · No card, no charge
Test your understanding of Analysing financial performance: How to construct and interpret break-even charts (to include: Break-even analysis should include: break-even output, margin of safety, contribution per unit, total contribution.)
Active recall beats re-reading. Take an instant quiz now to test what you’ve learned and lock it into long-term memory.
A week of Premium from your first lesson · Then the free plan continues · No card, no charge