AQA · A-Level · Business
Course version: 7132 · Version from Sept 2023
The interpretation, calculation and use of operations data in operational…
Full specification wording
Analysing operational performance: The interpretation, calculation and use of operations data in operational decision making and planning (to include: Students should be able to calculate: labour productivity, unit costs (average costs), capacity, capacity utilisation.)
Four numbers, each with its own unit, and the paper wants the meaning more than the arithmetic.
- 4 key terms
Study notes
From the teaching notes for this specification point.
The idea
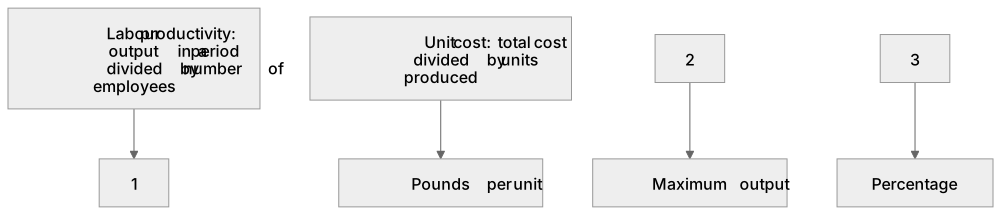
Four numbers, each with its own unit, and the paper wants the meaning more than the arithmetic. Labour productivity is output in a period divided by the number of employees, so it reads as units per worker, and a rise means the same wage bill is buying more output. Unit cost is total cost divided by units produced, in pounds per unit, and it falls as output rises because fixed costs are spread further. Capacity is the maximum output existing resources can make in a period, and capacity utilisation is actual output divided by that maximum, multiplied by one hundred to give a percentage. Around ninety per cent is comfortable; sixty per cent strands fixed costs on too few units and pushes cost per unit up; running flat out leaves no room for maintenance, no flexibility for a rush order and staff under real strain.
What earns the marks
- Setting out the figures that go into the formula before writing the answer, so the method still earns credit when the arithmetic slips.
- Attaching the unit to the number, so productivity is units per worker per period, unit cost is pounds per unit and capacity utilisation is a percentage.
- Interpreting the figure for the business rather than stopping at it, judging it against the firm's own earlier figure or a rival quoted in the case.
- Explaining the two routes to raising capacity utilisation, which are winning more demand and cutting capacity, and noting that the second usually brings redundancy costs.
Common mistakes and how to put them right
Turning the capacity utilisation fraction upside down, dividing maximum output by actual output, which reports a figure above one hundred per cent for a firm that is not even busy.
Mixing the time periods, dividing one month of actual output by a year of capacity, which makes utilisation look catastrophic.
Dividing by a headcount without adjusting for part time hours, which understates productivity wherever much of the workforce is part time.
Assuming full utilisation is the target, when it removes all slack, blocks maintenance and pushes defect rates and labour turnover up.
Exam tips
- These arrive first as short calculate questions worth two or four marks and then as the evidence for a longer analyse or assess question on the same firm, so keep your working to reuse it.
- Read the units in the stem carefully, because capacity is often quoted per week while output is quoted per month, and the conversion is where the marks go.
- Once you have a figure, add a sentence on what it means for this business; a bare number rarely earns the application mark on its own.
Try the lesson
The start of the Analysing operational performance: The interpretation, calculation and use of operations data in operational decision making and planning (to include: Students should be able to calculate: labour productivity, unit costs (average costs), capacity, capacity utilisation.) lesson, made from teaching notes for this specification point.
Have a go first
A factory produces 4,000 units in a week using 200 labour hours. What is its labour productivity in units per labour hour?
Listen
Four numbers, each with its own unit, and the paper wants the meaning more than the arithmetic. Labour productivity is output in a period divided by the number of employees, so it reads as units per worker, and a rise means the same wage bill is buying more output. Unit cost is total cost divided by units produced, in pounds per unit, and it falls as output rises because fixed costs are spread further. Capacity is the maximum output existing resources can make in a period, and capacity utilisation is actual output divided by that maximum, multiplied by one hundred to give a percentage. Around ninety per cent is comfortable; sixty per cent strands fixed costs on too few units and pushes cost per unit up; running flat out leaves no room for maintenance, no flexibility for a rush order and staff under real strain. A strong answer earns marks for these points. Setting out the figures that go into the formula before writing the answer, so the method still earns credit when the arithmetic slips. Attaching the unit to the number, so productivity is units per worker per period, unit cost is pounds per unit and capacity utilisation is a percentage. Interpreting the figure for the business rather than stopping at it, judging it against the firm's own earlier figure or a rival quoted in the case. Explaining the two routes to raising capacity utilisation, which are winning more demand and cutting capacity, and noting that the second usually brings redundancy costs. Exam tip: These arrive first as short calculate questions worth two or four marks and then as the evidence for a longer analyse or assess question on the same firm, so keep your working to reuse it.
See it

Key words
Say what each word means before you turn the card.
labour productivity
Try answering aloud or in your head before turning the card.
unit cost
Try answering aloud or in your head before turning the card.
capacity
Try answering aloud or in your head before turning the card.
capacity utilisation
Try answering aloud or in your head before turning the card.
See every definition
- labour productivity
- Output in a period divided by the number of employees, so it reads as units per worker.
- unit cost
- Total cost divided by units produced, in pounds per unit, and it falls as output rises because fixed costs are spread further.
- capacity
- The maximum output existing resources can make in a period.
- capacity utilisation
- Actual output divided by that maximum, multiplied by one hundred to give a percentage.
Label the diagram
Some boxes have lost their names. Pick the right name for each number.
1Box 1
2Box 2
3Box 3
There is more to this lesson
The full lesson goes on to check your understanding and help you earn the marks. Create a free account to carry on, with your progress saved.
A week of Premium from your first lesson · Then the free plan continues · No card, no charge
Test your understanding of Analysing operational performance: The interpretation, calculation and use of operations data in operational decision making and planning (to include: Students should be able to calculate: labour productivity, unit costs (average costs), capacity, capacity utilisation.)
Active recall beats re-reading. Take an instant quiz now to test what you’ve learned and lock it into long-term memory.
A week of Premium from your first lesson · Then the free plan continues · No card, no charge