OCR · A-Level · Chemistry
Course version: H432 · Version from Sept 2017
(b) interpretation of gas chromatograms in terms of:
Full specification wording
Chromatography and qualitative analysis: (b) interpretation of gas chromatograms in terms of:
A gas chromatogram plots detector response against time for the components of a vaporised mixture carried through a column by a mobile gas phase.
- Point 3 of 14
- 3 key terms
Study notes
From the teaching notes for this specification point.
The idea
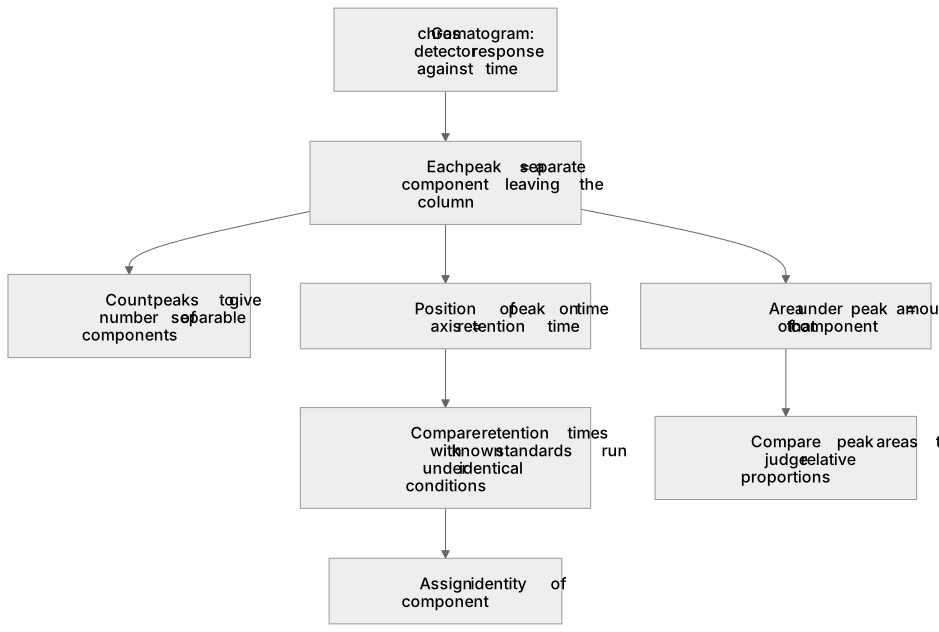
A gas chromatogram plots detector response against time for the components of a vaporised mixture carried through a column by a mobile gas phase. Interpretation means reading the trace to identify how many components are present and which is which. Each peak corresponds to a component emerging from the column; the number of peaks indicates the number of separable components. The position of a peak along the time axis gives its retention time, and the area under a peak relates to the amount of that component. You compare retention times with those of known standards run under identical conditions to assign identities, and you compare peak areas to judge relative proportions. This statement is the umbrella for the sub-clauses, including retention times, that follow it.
What earns the marks
- States that each peak on a gas chromatogram represents a separate component leaving the column.
- Identifies the number of components from the number of peaks in the trace.
- Uses the position of a peak on the time axis to read off a retention time.
- Relates the area under a peak to the amount of that component in the mixture.
- Compares retention times with those of known standards run under the same conditions to identify a component.
Common mistakes and how to put them right
Assumes peak height alone gives the amount of a component.
Put it right: Use peak area, since area accounts for both height and width.
Treats the number of peaks as the number of atoms or elements.
Put it right: Recognise that each peak is a separable component of the mixture.
Identifies a component from its retention time without matching conditions.
Put it right: Compare with a standard run under identical column and temperature conditions.
Exam tips
- Read the axes first: confirm the horizontal axis is time and the vertical axis is detector response before interpreting peaks.
- Count peaks to state the number of components, then use retention times to assign identities against standards.
- When asked about amounts, refer to peak areas rather than peak heights.
Try the lesson
The start of the Chromatography and qualitative analysis: (b) interpretation of gas chromatograms in terms of: lesson, made from teaching notes for this specification point.
Listen
A gas chromatogram plots detector response against time for the components of a vaporised mixture carried through a column by a mobile gas phase. Interpretation means reading the trace to identify how many components are present and which is which. Each peak corresponds to a component emerging from the column; the number of peaks indicates the number of separable components. The position of a peak along the time axis gives its retention time, and the area under a peak relates to the amount of that component. You compare retention times with those of known standards run under identical conditions to assign identities, and you compare peak areas to judge relative proportions. This statement is the umbrella for the sub-clauses, including retention times, that follow it. A strong answer earns marks for these points. States that each peak on a gas chromatogram represents a separate component leaving the column. Identifies the number of components from the number of peaks in the trace. Uses the position of a peak on the time axis to read off a retention time. Relates the area under a peak to the amount of that component in the mixture. Exam tip: Read the axes first: confirm the horizontal axis is time and the vertical axis is detector response before interpreting peaks.
See it
Key words
Say what each word means before you turn the card.
Number of peaks gives number of components
Try answering aloud or in your head before turning the card.
Peak area relates to amount of component
Try answering aloud or in your head before turning the card.
Chromatogram is a detector response against time
Try answering aloud or in your head before turning the card.
See every definition
- Number of peaks gives number of components
- Each peak on a gas chromatogram represents a separate component leaving the column, so the number of peaks indicates the number of separable components.
- Peak area relates to amount of component
- The area under a peak relates to the amount of that component in the mixture, and peak areas are compared to judge relative proportions.
- Chromatogram is a detector response against time
- A gas chromatogram plots detector response against time for the components of a vaporised mixture carried through a column by a mobile gas phase.
Label the diagram
Some boxes have lost their names. Pick the right name for each number.
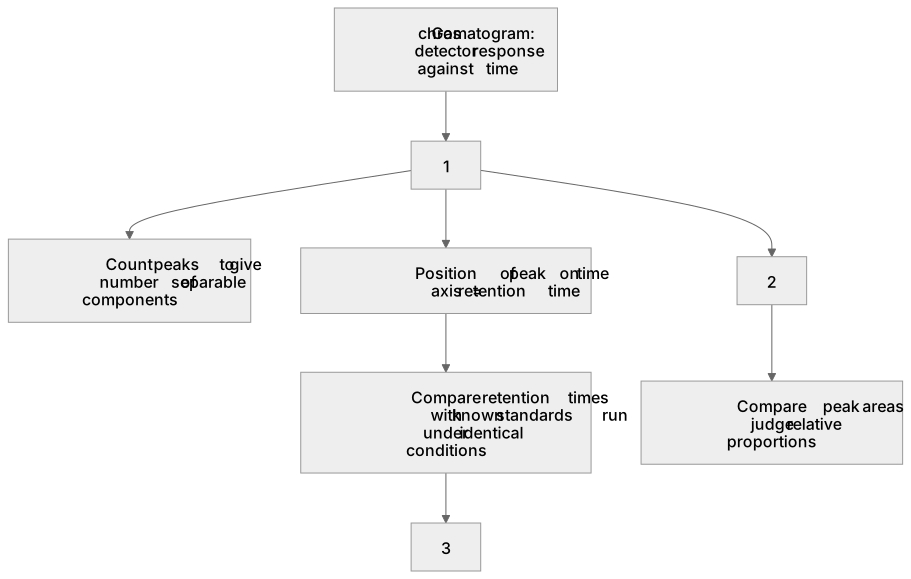
1Box 1
2Box 2
3Box 3
There is more to this lesson
The full lesson goes on to check your understanding and help you earn the marks. Create a free account to carry on, with your progress saved.
A week of Premium from your first lesson · Then the free plan continues · No card, no charge
Test your understanding of Chromatography and qualitative analysis: (b) interpretation of gas chromatograms in terms of:
Active recall beats re-reading. Take an instant quiz now to test what you’ve learned and lock it into long-term memory.
A week of Premium from your first lesson · Then the free plan continues · No card, no charge