OCR · A-Level · Chemistry
Course version: H432 · Version from Sept 2017
(e) from a concentration–time graph of a first order reaction, measurement…
Full specification wording
How fast?: (e) from a concentration–time graph of a first order reaction, measurement of constant half-life, t₁/₂
A first order reaction has a rate proportional to the concentration of one reactant, so its concentration–time curve falls steeply at first and then flattens.
- Point 7 of 18
- 4 key terms
Study notes
From the teaching notes for this specification point.
The idea
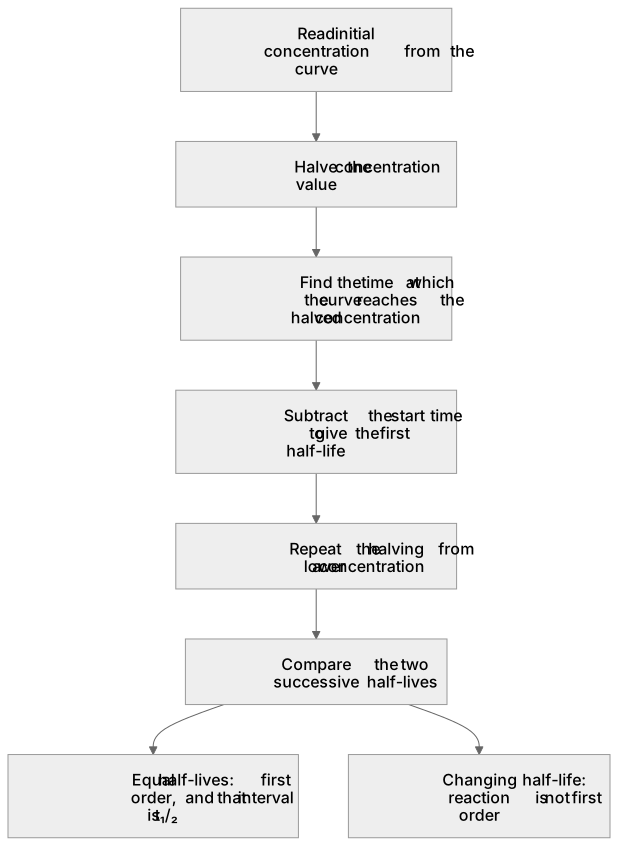
A first order reaction has a rate proportional to the concentration of one reactant, so its concentration–time curve falls steeply at first and then flattens. Its defining feature is a constant half-life: the time for the concentration to halve is the same at every starting concentration. To measure t₁/₂ from a graph, read the concentration at a chosen start point, halve that value, find the time at which the curve reaches it, and subtract the start time. Repeat from a second, lower concentration. If the two intervals are equal within reading error, the reaction is first order and that interval is t₁/₂.
What earns the marks
- Reads the initial concentration from the curve and halves it to locate the first half-life on the time axis.
- Repeats the halving from a lower concentration and compares the two time intervals.
- Concludes that equal successive half-lives identify a first order reaction.
- States that a constant half-life means the half-life is independent of the starting concentration.
Common mistakes and how to put them right
Halves the time axis instead of the concentration axis.
Put it right: Halve the concentration value and read off the corresponding time.
Measures only one half-life and declares first order.
Put it right: Measure at least two successive half-lives and compare them.
Treats a changing half-life as evidence of first order.
Put it right: A changing half-life indicates the reaction is not first order.
Exam tips
- Show the halving values and the times you read on the graph so the method is visible.
- Compare two successive half-lives numerically rather than asserting they look equal.
- Quote t₁/₂ with the unit taken from the time axis.
Try the lesson
The start of the How fast?: (e) from a concentration–time graph of a first order reaction, measurement of constant half-life, t₁/₂ lesson, made from teaching notes for this specification point.
Listen
A first order reaction has a rate proportional to the concentration of one reactant, so its concentration–time curve falls steeply at first and then flattens. Its defining feature is a constant half-life: the time for the concentration to halve is the same at every starting concentration. To measure t₁/₂ from a graph, read the concentration at a chosen start point, halve that value, find the time at which the curve reaches it, and subtract the start time. Repeat from a second, lower concentration. If the two intervals are equal within reading error, the reaction is first order and that interval is t₁/₂. A strong answer earns marks for these points. Reads the initial concentration from the curve and halves it to locate the first half-life on the time axis. Repeats the halving from a lower concentration and compares the two time intervals. Concludes that equal successive half-lives identify a first order reaction. States that a constant half-life means the half-life is independent of the starting concentration. Exam tip: Show the halving values and the times you read on the graph so the method is visible.
See it
Key words
Say what each word means before you turn the card.
First order kinetics
Try answering aloud or in your head before turning the card.
Constant half-life
Try answering aloud or in your head before turning the card.
Concentration–time graphs
Try answering aloud or in your head before turning the card.
Graph reading and comparison
Try answering aloud or in your head before turning the card.
See every definition
- First order kinetics
- A reaction whose rate is proportional to the concentration of one reactant, so its concentration–time curve falls steeply at first and then flattens.
- Constant half-life
- The time for the concentration to halve is the same at every starting concentration, which is the defining feature of a first order reaction.
- Concentration–time graphs
- A plot from which the concentration at a chosen start point is read and halved to locate the first half-life on the time axis.
- Graph reading and comparison
- Halve the concentration value, read off the corresponding time, and repeat from a lower concentration to compare the two time intervals.
Label the diagram
Some boxes have lost their names. Pick the right name for each number.
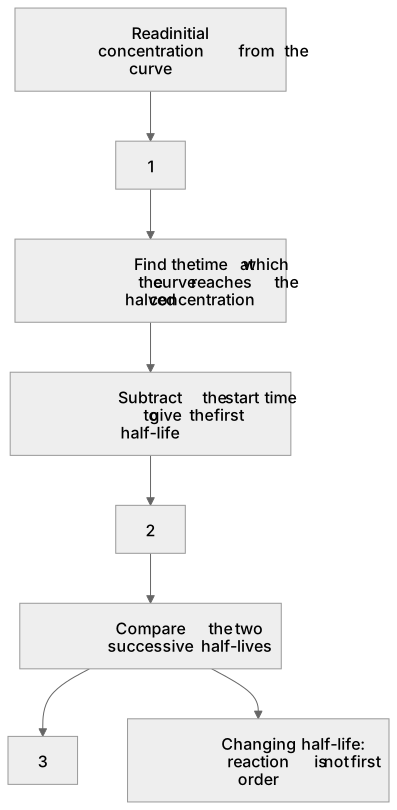
1Box 1
2Box 2
3Box 3
There is more to this lesson
The full lesson goes on to check your understanding and help you earn the marks. Create a free account to carry on, with your progress saved.
A week of Premium from your first lesson · Then the free plan continues · No card, no charge
Test your understanding of How fast?: (e) from a concentration–time graph of a first order reaction, measurement of constant half-life, t₁/₂
Active recall beats re-reading. Take an instant quiz now to test what you’ve learned and lock it into long-term memory.
A week of Premium from your first lesson · Then the free plan continues · No card, no charge