OCR · A-Level · Chemistry
Course version: H432 · Version from Sept 2017
• measurement of melting points
Full specification wording
Nitrogen compounds, polymers and synthesis - 6.2.5 Organic synthesis: • measurement of melting points
Melting-point measurement identifies a solid organic product and tests its purity.
- Point 8 of 11
- 4 key terms
Study notes
From the teaching notes for this specification point.
The idea
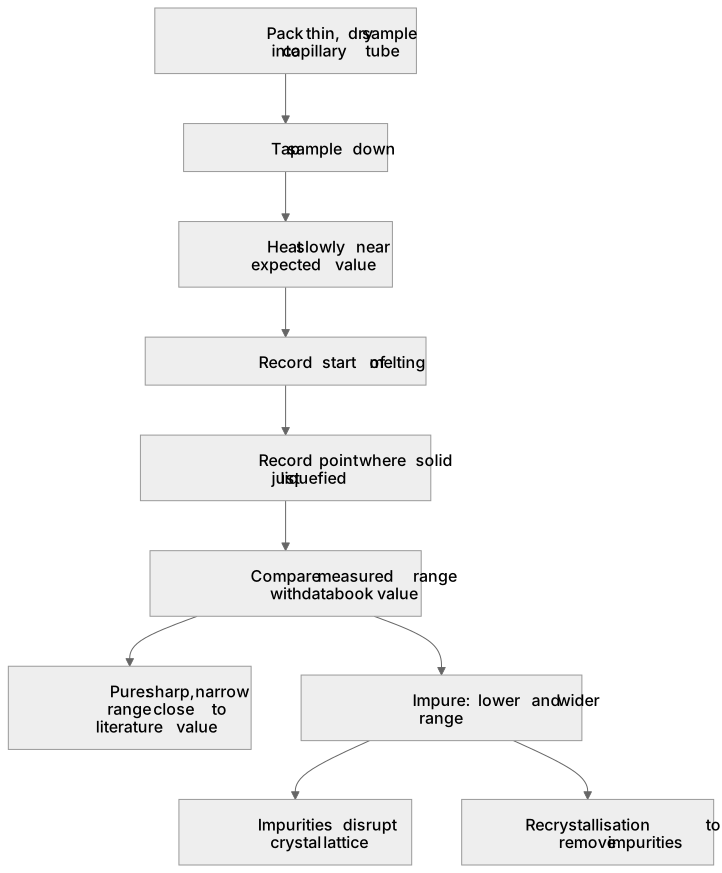
Melting-point measurement identifies a solid organic product and tests its purity. Pack a thin, dry sample into a capillary tube, tap it down, and heat slowly near the expected value so the rise is gradual. Record the range from the first sign of melting to the point where the solid has just liquefied. A pure solid melts sharply over a narrow range close to its literature value; an impure solid melts lower and over a wider range because impurities disrupt the crystal lattice. Compare your measured range with a data book value for the compound you synthesised. A melting point well below the literature figure, or a broad range, signals impurities that recrystallisation should remove.
What earns the marks
- Identifies that a pure solid melts sharply over a narrow temperature range close to its literature value.
- Explains that impurities lower the melting point and broaden the melting range by disrupting the crystal lattice.
- States that the sample is heated slowly near the expected melting point so the range is read accurately.
- Recognises that a measured range far below the data book value indicates an impure product needing purification.
Common mistakes and how to put them right
Heats the capillary rapidly throughout.
Put it right: Slow the heating near the expected value so the range is read accurately.
Assumes a high melting point always means a pure sample.
Put it right: Compare the range with the literature value and check its width.
Ignores the width of the range and records only one temperature.
Put it right: Record both the start and end of melting.
Exam tips
- Link the narrowness of the range to purity, not just the numerical value.
- Quote the measured range alongside the literature value when judging purity.
- Explain the lattice-disruption reason for depression rather than merely stating that impurities lower the value.
Try the lesson
The start of the Nitrogen compounds, polymers and synthesis - 6.2.5 Organic synthesis: • measurement of melting points lesson, made from teaching notes for this specification point.
Listen
Melting-point measurement identifies a solid organic product and tests its purity. Pack a thin, dry sample into a capillary tube, tap it down, and heat slowly near the expected value so the rise is gradual. Record the range from the first sign of melting to the point where the solid has just liquefied. A pure solid melts sharply over a narrow range close to its literature value; an impure solid melts lower and over a wider range because impurities disrupt the crystal lattice. Compare your measured range with a data book value for the compound you synthesised. A melting point well below the literature figure, or a broad range, signals impurities that recrystallisation should remove. A strong answer earns marks for these points. Identifies that a pure solid melts sharply over a narrow temperature range close to its literature value. Explains that impurities lower the melting point and broaden the melting range by disrupting the crystal lattice. States that the sample is heated slowly near the expected melting point so the range is read accurately. Recognises that a measured range far below the data book value indicates an impure product needing purification. Exam tip: Link the narrowness of the range to purity, not just the numerical value.
See it
Key words
Say what each word means before you turn the card.
Purity and identification of organic solids
Try answering aloud or in your head before turning the card.
Melting point range versus single value
Try answering aloud or in your head before turning the card.
Effect of impurities on melting point
Try answering aloud or in your head before turning the card.
Comparison with literature data
Try answering aloud or in your head before turning the card.
See every definition
- Purity and identification of organic solids
- Melting-point measurement identifies a solid organic product and tests its purity, with a pure solid melting sharply over a narrow range close to its literature value.
- Melting point range versus single value
- The range is recorded from the first sign of melting to the point where the solid has just liquefied, rather than recording only one temperature.
- Effect of impurities on melting point
- An impure solid melts lower and over a wider range because impurities disrupt the crystal lattice.
- Comparison with literature data
- The measured range is compared with a data book value for the compound synthesised, and a melting point well below the literature figure or a broad range signals impurities that recrystallisation should remove.
Label the diagram
Some boxes have lost their names. Pick the right name for each number.
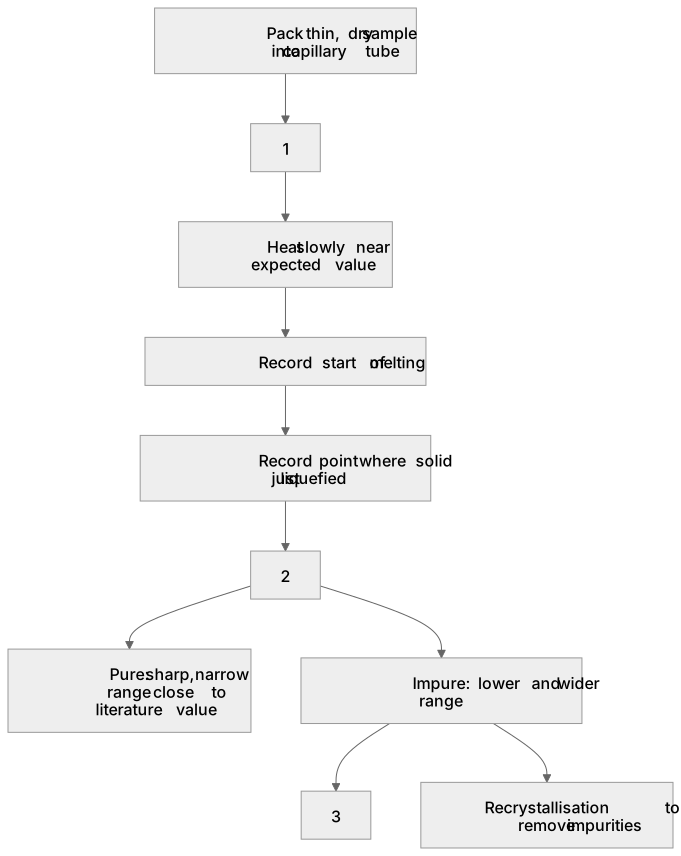
1Box 1
2Box 2
3Box 3
There is more to this lesson
The full lesson goes on to check your understanding and help you earn the marks. Create a free account to carry on, with your progress saved.
A week of Premium from your first lesson · Then the free plan continues · No card, no charge
Test your understanding of Nitrogen compounds, polymers and synthesis - 6.2.5 Organic synthesis: • measurement of melting points
Active recall beats re-reading. Take an instant quiz now to test what you’ve learned and lock it into long-term memory.
A week of Premium from your first lesson · Then the free plan continues · No card, no charge