Probability Revision Notes

    Subject: Mathematics | Level: A-Level | Exam Board: AQA

    This guide provides a comprehensive overview of A-Level Probability, focusing on the key concepts, formulas, and exam techniques required by AQA. It breaks down complex ideas into manageable chunks, using visual aids and real-world examples to build a solid foundation for tackling exam questions with confidence.

    Revision Notes & Key Concepts

    ![Header image for A-Level Mathematics: Probability](https://xnnrgnazirrqvdgfhvou.supabase.co/storage/v1/object/public/study-guide-assets/guide_479a92b8-f665-4f1a-9051-5853f7e48444/header_image.png) ## Overview Probability is a fundamental branch of mathematics that deals with the likelihood of events occurring. For A-Level Maths, AQA requires a deep and rigorous understanding of probability, moving far beyond simple coin flips. This topic expects you to become fluent in the language of set theory, to master the logic of conditional events, and to confidently test for statistical independence. It forms a cornerstone of statistics and has profound connections to other areas of mathematics like binomial expansion and integration. In the exam, you can expect to see a range of questions, from short, definition-based questions to long, multi-part problems that require you to model a real-world scenario, often drawing from the Large Data Set. Success in this topic hinges on selecting the right tool for the job – whether that’s a Venn diagram, a tree diagram, or a specific formula – and executing your solution with precision. {{asset:probability_podcast.mp3}} ## Key Concepts ### Concept 1: Set Notation and Venn Diagrams At its heart, probability is built on the language of sets. You must be able to read and use this notation fluently. A **set** is simply a collection of outcomes, and an **event** is a specific set of outcomes we are interested in. The entire range of possible outcomes is called the **sample space**. - **Union (A ∪ B)**: This means the outcome is in set A OR set B OR both. It represents the total area covered by both circles in a Venn diagram. - **Intersection (A ∩ B)**: This means the outcome must be in BOTH set A AND set B. It is the overlapping region of the circles in a Venn diagram. - **Complement (A')**: This means the outcome is NOT in set A. It is everything in the sample space outside of the circle for A. Venn diagrams are the most powerful tool for visualizing these relationships. They allow you to map out the probabilities associated with different combinations of events. For full marks, always ensure the probabilities in all regions of your Venn diagram, including the area outside the circles (representing 'neither' event), sum to 1. ![A Venn diagram illustrating the probabilities of two events, A and B.](https://xnnrgnazirrqvdgfhvou.supabase.co/storage/v1/object/public/study-guide-assets/guide_479a92b8-f665-4f1a-9051-5853f7e48444/venn_diagram_example.png) ### Concept 2: Mutually Exclusive vs. Independent Events This is a critical distinction that is frequently misunderstood and therefore a favourite of examiners. - **Mutually Exclusive Events**: These are events that CANNOT happen at the same time. For example, when rolling a single die, the events 'rolling a 5' and 'rolling a 6' are mutually exclusive. If one happens, the other cannot. The key mathematical property is that their intersection is zero: **P(A ∩ B) = 0**. On a Venn diagram, the circles for mutually exclusive events do not overlap. - **Independent Events**: These are events where the outcome of one has NO effect on the outcome of the other. For example, flipping a coin and then rolling a die. The coin's result doesn't influence the die's result. The crucial test for independence is: **P(A ∩ B) = P(A) x P(B)**. You MUST show this calculation explicitly in an exam to prove independence. Do not just state it. ### Concept 3: Conditional Probability The phrase 'given that' is your signal that you are dealing with conditional probability. It means you are working with a restricted sample space. The notation is **P(A|B)**, which reads 'the probability of A given that B has occurred'. The formula is: **P(A|B) = P(A ∩ B) / P(B)** Think of it this way: you are no longer considering the entire sample space. You are now living in a world where event B has definitely happened. So, your new 'whole' is P(B). The part of that 'new whole' that you are interested in is the part that is also in A, which is the intersection P(A ∩ B). This is a high-level skill that examiners use to differentiate candidates. ![Visual explanation of conditional probability P(A|B).](https://xnnrgnazirrqvdgfhvou.supabase.co/storage/v1/object/public/study-guide-assets/guide_479a92b8-f665-4f1a-9051-5853f7e48444/conditional_probability_visual.png) ### Concept 4: Tree Diagrams Tree diagrams are your go-to tool for modelling experiments with multiple stages, especially when the probabilities change at each stage (known as 'without replacement'). - **Structure**: The first set of branches represents the outcomes of the first stage. The second set of branches extends from the end of the first, representing the second stage. - **Key Rules**: 1. **Multiply along the branches** to find the probability of a specific sequence of outcomes. 2. **Add down the list of final outcomes** to find the overall probability of an event that can happen in multiple ways (e.g., picking one red and one blue counter in any order). ![A tree diagram illustrating a two-stage experiment without replacement.](https://xnnrgnazirrqvdgfhvou.supabase.co/storage/v1/object/public/study-guide-assets/guide_479a92b8-f665-4f1a-9051-5853f7e48444/tree_diagram_example.png) ## Mathematical/Scientific Relationships Here are the key formulas you will need. It is vital to know which are on the formula sheet and which you must memorise. - **The Addition Rule (Given on formula sheet)**: `P(A ∪ B) = P(A) + P(B) - P(A ∩ B)` *Use this when you want to find the probability of 'A or B' and the events are not mutually exclusive.* - **The Conditional Probability Formula (Given on formula sheet)**: `P(A|B) = P(A ∩ B) / P(B)` *Use this whenever you see the phrase 'given that' or are dealing with a restricted sample space.* - **The Test for Independence (Must memorise)**: `Events A and B are independent if and only if P(A ∩ B) = P(A) x P(B)` *This is not just a formula, but a test you must perform and conclude upon. You must calculate both sides separately and compare them.* ## Practical Applications Probability is not just an abstract concept; it underpins many real-world systems: - **Insurance**: Companies use probability to calculate the likelihood of events like car accidents or house fires to set premium prices. - **Medical Testing**: The accuracy of a medical test is described using conditional probability – the probability of having a disease given a positive test result. - **Finance and Investing**: Analysts use probability to model the risk and potential return of different investments. - **The Large Data Set**: You will be expected to apply your knowledge of probability to analyse the real-world data provided by AQA, for example, by calculating the probability that a journey of a certain length occurs in a specific location.

    Key Terms & Definitions

    Sample Space
    The set of all possible outcomes of an experiment.
    Event
    A subset of the sample space; a set of one or more outcomes.
    Mutually Exclusive Events
    Events that have no outcomes in common. They cannot occur at the same time. P(A ∩ B) = 0.
    Independent Events
    The occurrence of one event has no effect on the probability of the other event occurring. P(A ∩ B) = P(A) x P(B).
    Conditional Probability
    The probability of an event occurring, given that another event has already occurred.
    Complement
    The event that A does not occur, denoted A'. P(A') = 1 - P(A).

    Worked Examples

    Practice Questions

    Probability

    AQA
    A-Level
    Mathematics

    This guide provides a comprehensive overview of A-Level Probability, focusing on the key concepts, formulas, and exam techniques required by AQA. It breaks down complex ideas into manageable chunks, using visual aids and real-world examples to build a solid foundation for tackling exam questions with confidence.

    6
    Min Read
    3
    Examples
    5
    Questions
    6
    Key Terms
    🎙 Podcast Episode
    Probability
    0:00-0:00

    Study Notes

    Header image for A-Level Mathematics: Probability

    Overview

    Probability is a fundamental branch of mathematics that deals with the likelihood of events occurring. For A-Level Maths, AQA requires a deep and rigorous understanding of probability, moving far beyond simple coin flips. This topic expects you to become fluent in the language of set theory, to master the logic of conditional events, and to confidently test for statistical independence. It forms a cornerstone of statistics and has profound connections to other areas of mathematics like binomial expansion and integration. In the exam, you can expect to see a range of questions, from short, definition-based questions to long, multi-part problems that require you to model a real-world scenario, often drawing from the Large Data Set. Success in this topic hinges on selecting the right tool for the job – whether that’s a Venn diagram, a tree diagram, or a specific formula – and executing your solution with precision.

    Key Concepts

    Concept 1: Set Notation and Venn Diagrams

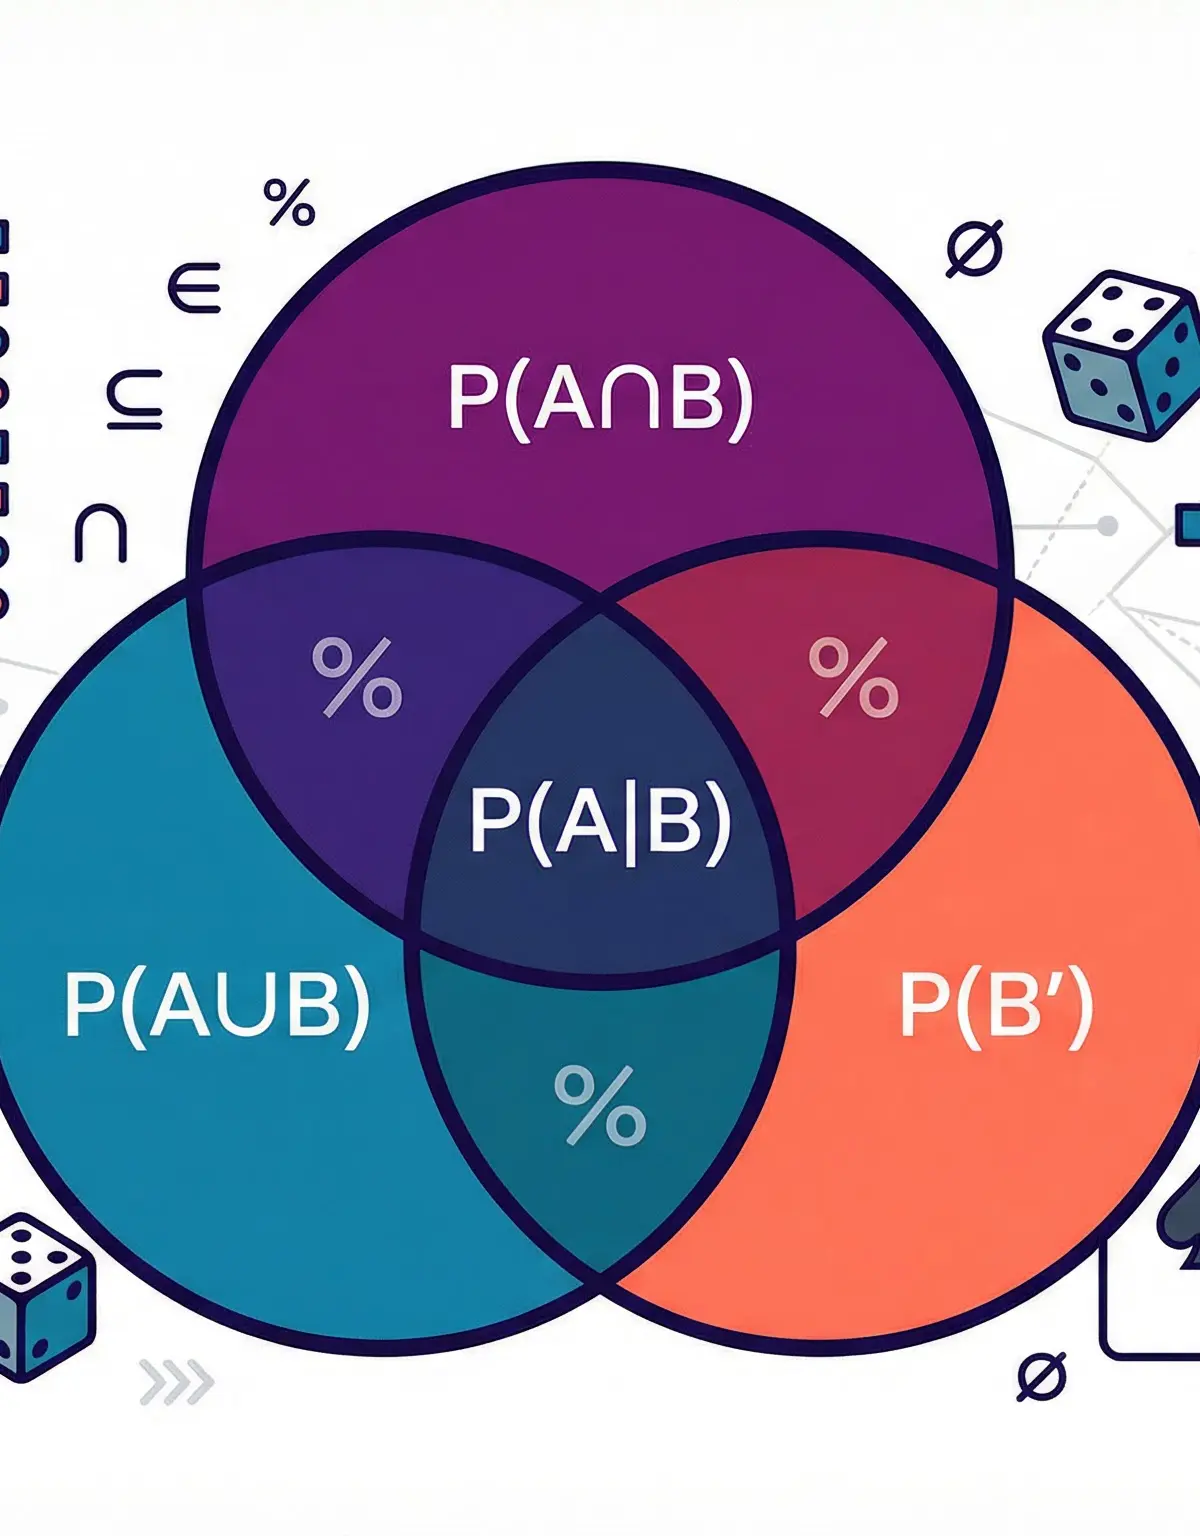
    At its heart, probability is built on the language of sets. You must be able to read and use this notation fluently. A set is simply a collection of outcomes, and an event is a specific set of outcomes we are interested in. The entire range of possible outcomes is called the sample space.

    • Union (A ∪ B): This means the outcome is in set A OR set B OR both. It represents the total area covered by both circles in a Venn diagram.
    • Intersection (A ∩ B): This means the outcome must be in BOTH set A AND set B. It is the overlapping region of the circles in a Venn diagram.
    • Complement (A'): This means the outcome is NOT in set A. It is everything in the sample space outside of the circle for A.

    Venn diagrams are the most powerful tool for visualizing these relationships. They allow you to map out the probabilities associated with different combinations of events. For full marks, always ensure the probabilities in all regions of your Venn diagram, including the area outside the circles (representing 'neither' event), sum to 1.
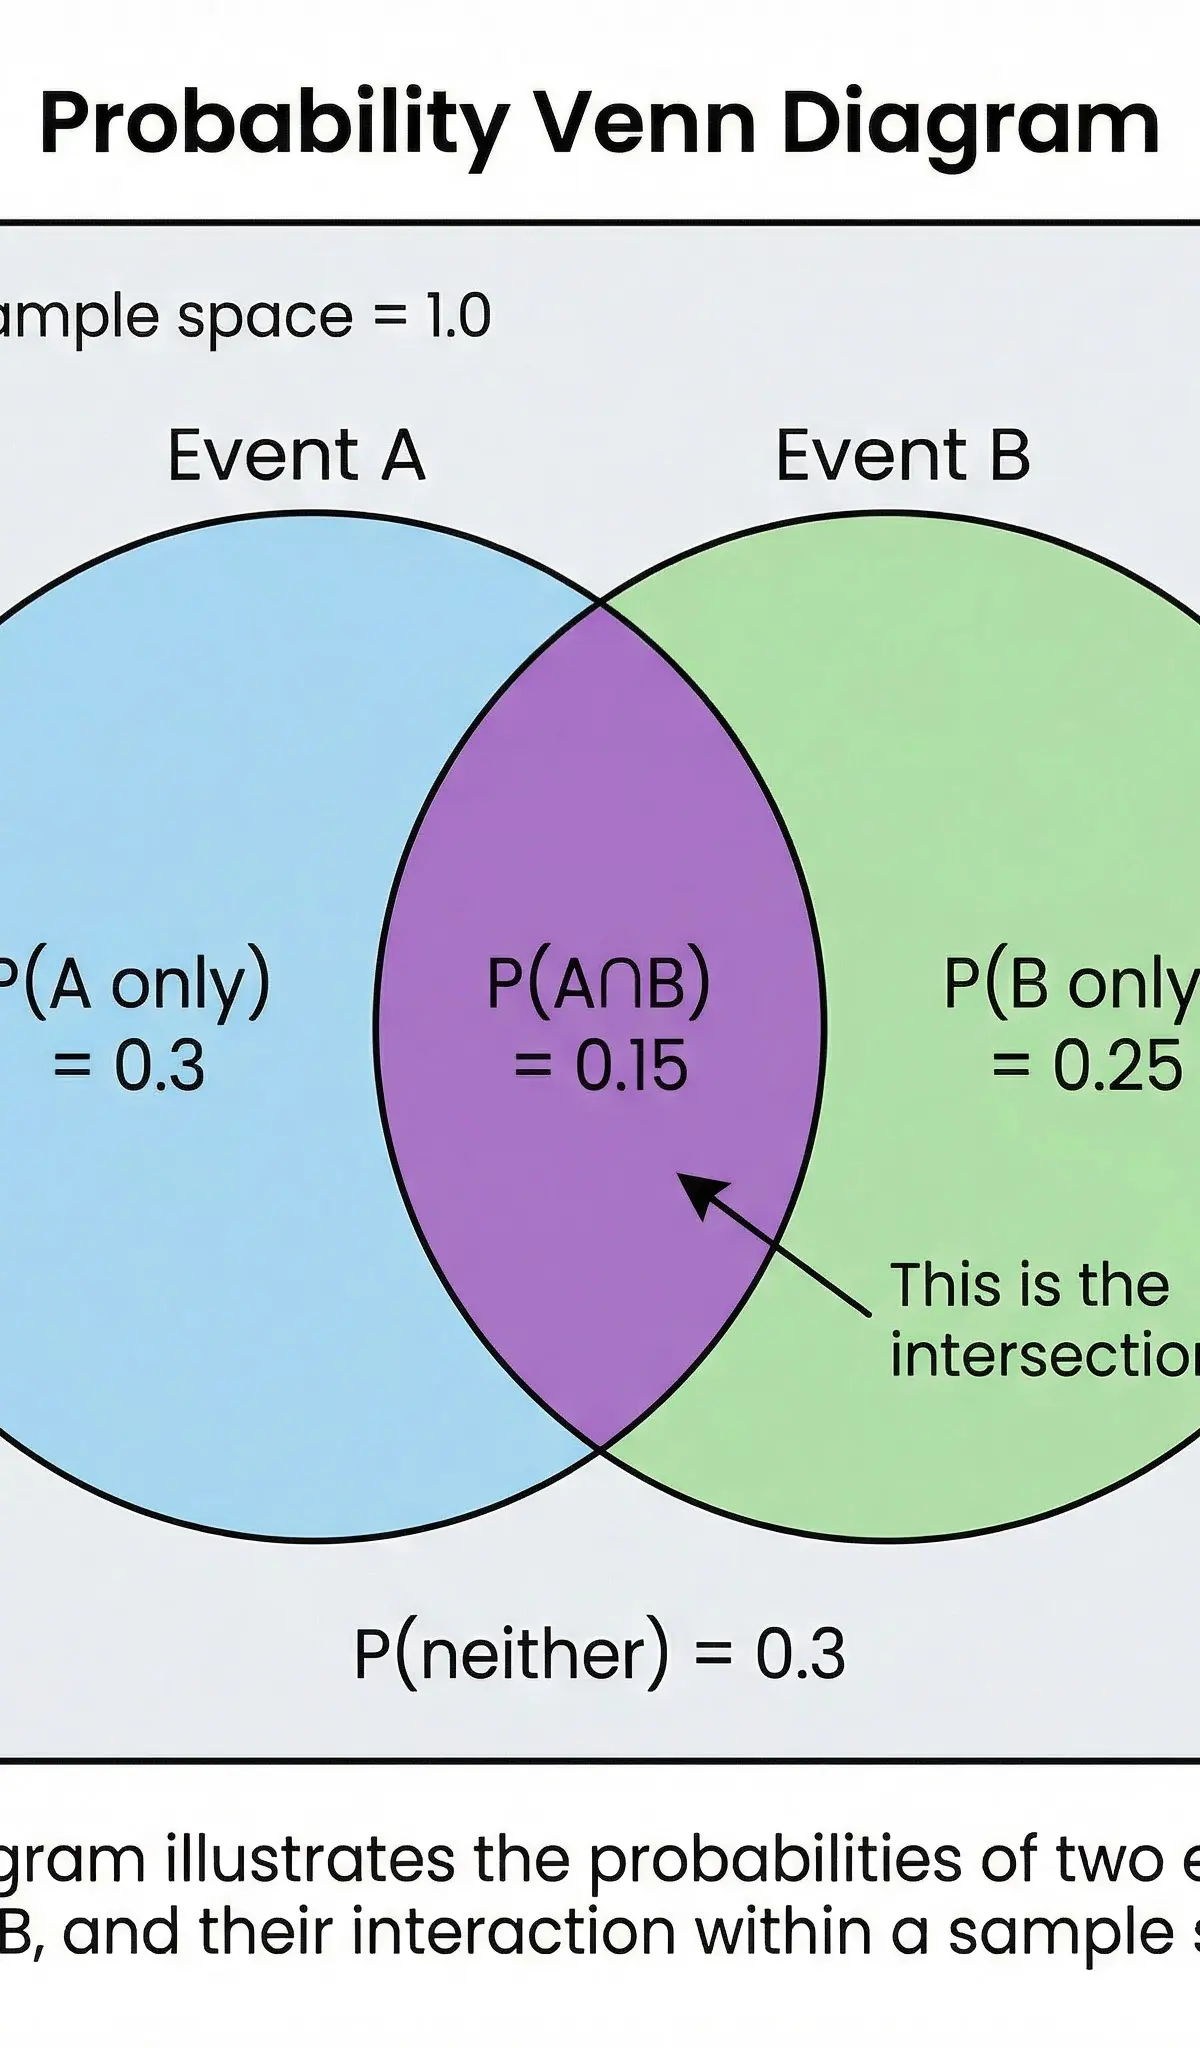
    A Venn diagram illustrating the probabilities of two events, A and B.

    Concept 2: Mutually Exclusive vs. Independent Events

    This is a critical distinction that is frequently misunderstood and therefore a favourite of examiners.

    • Mutually Exclusive Events: These are events that CANNOT happen at the same time. For example, when rolling a single die, the events 'rolling a 5' and 'rolling a 6' are mutually exclusive. If one happens, the other cannot. The key mathematical property is that their intersection is zero: P(A ∩ B) = 0. On a Venn diagram, the circles for mutually exclusive events do not overlap.

    • Independent Events: These are events where the outcome of one has NO effect on the outcome of the other. For example, flipping a coin and then rolling a die. The coin's result doesn't influence the die's result. The crucial test for independence is: P(A ∩ B) = P(A) x P(B). You MUST show this calculation explicitly in an exam to prove independence. Do not just state it.

    Concept 3: Conditional Probability

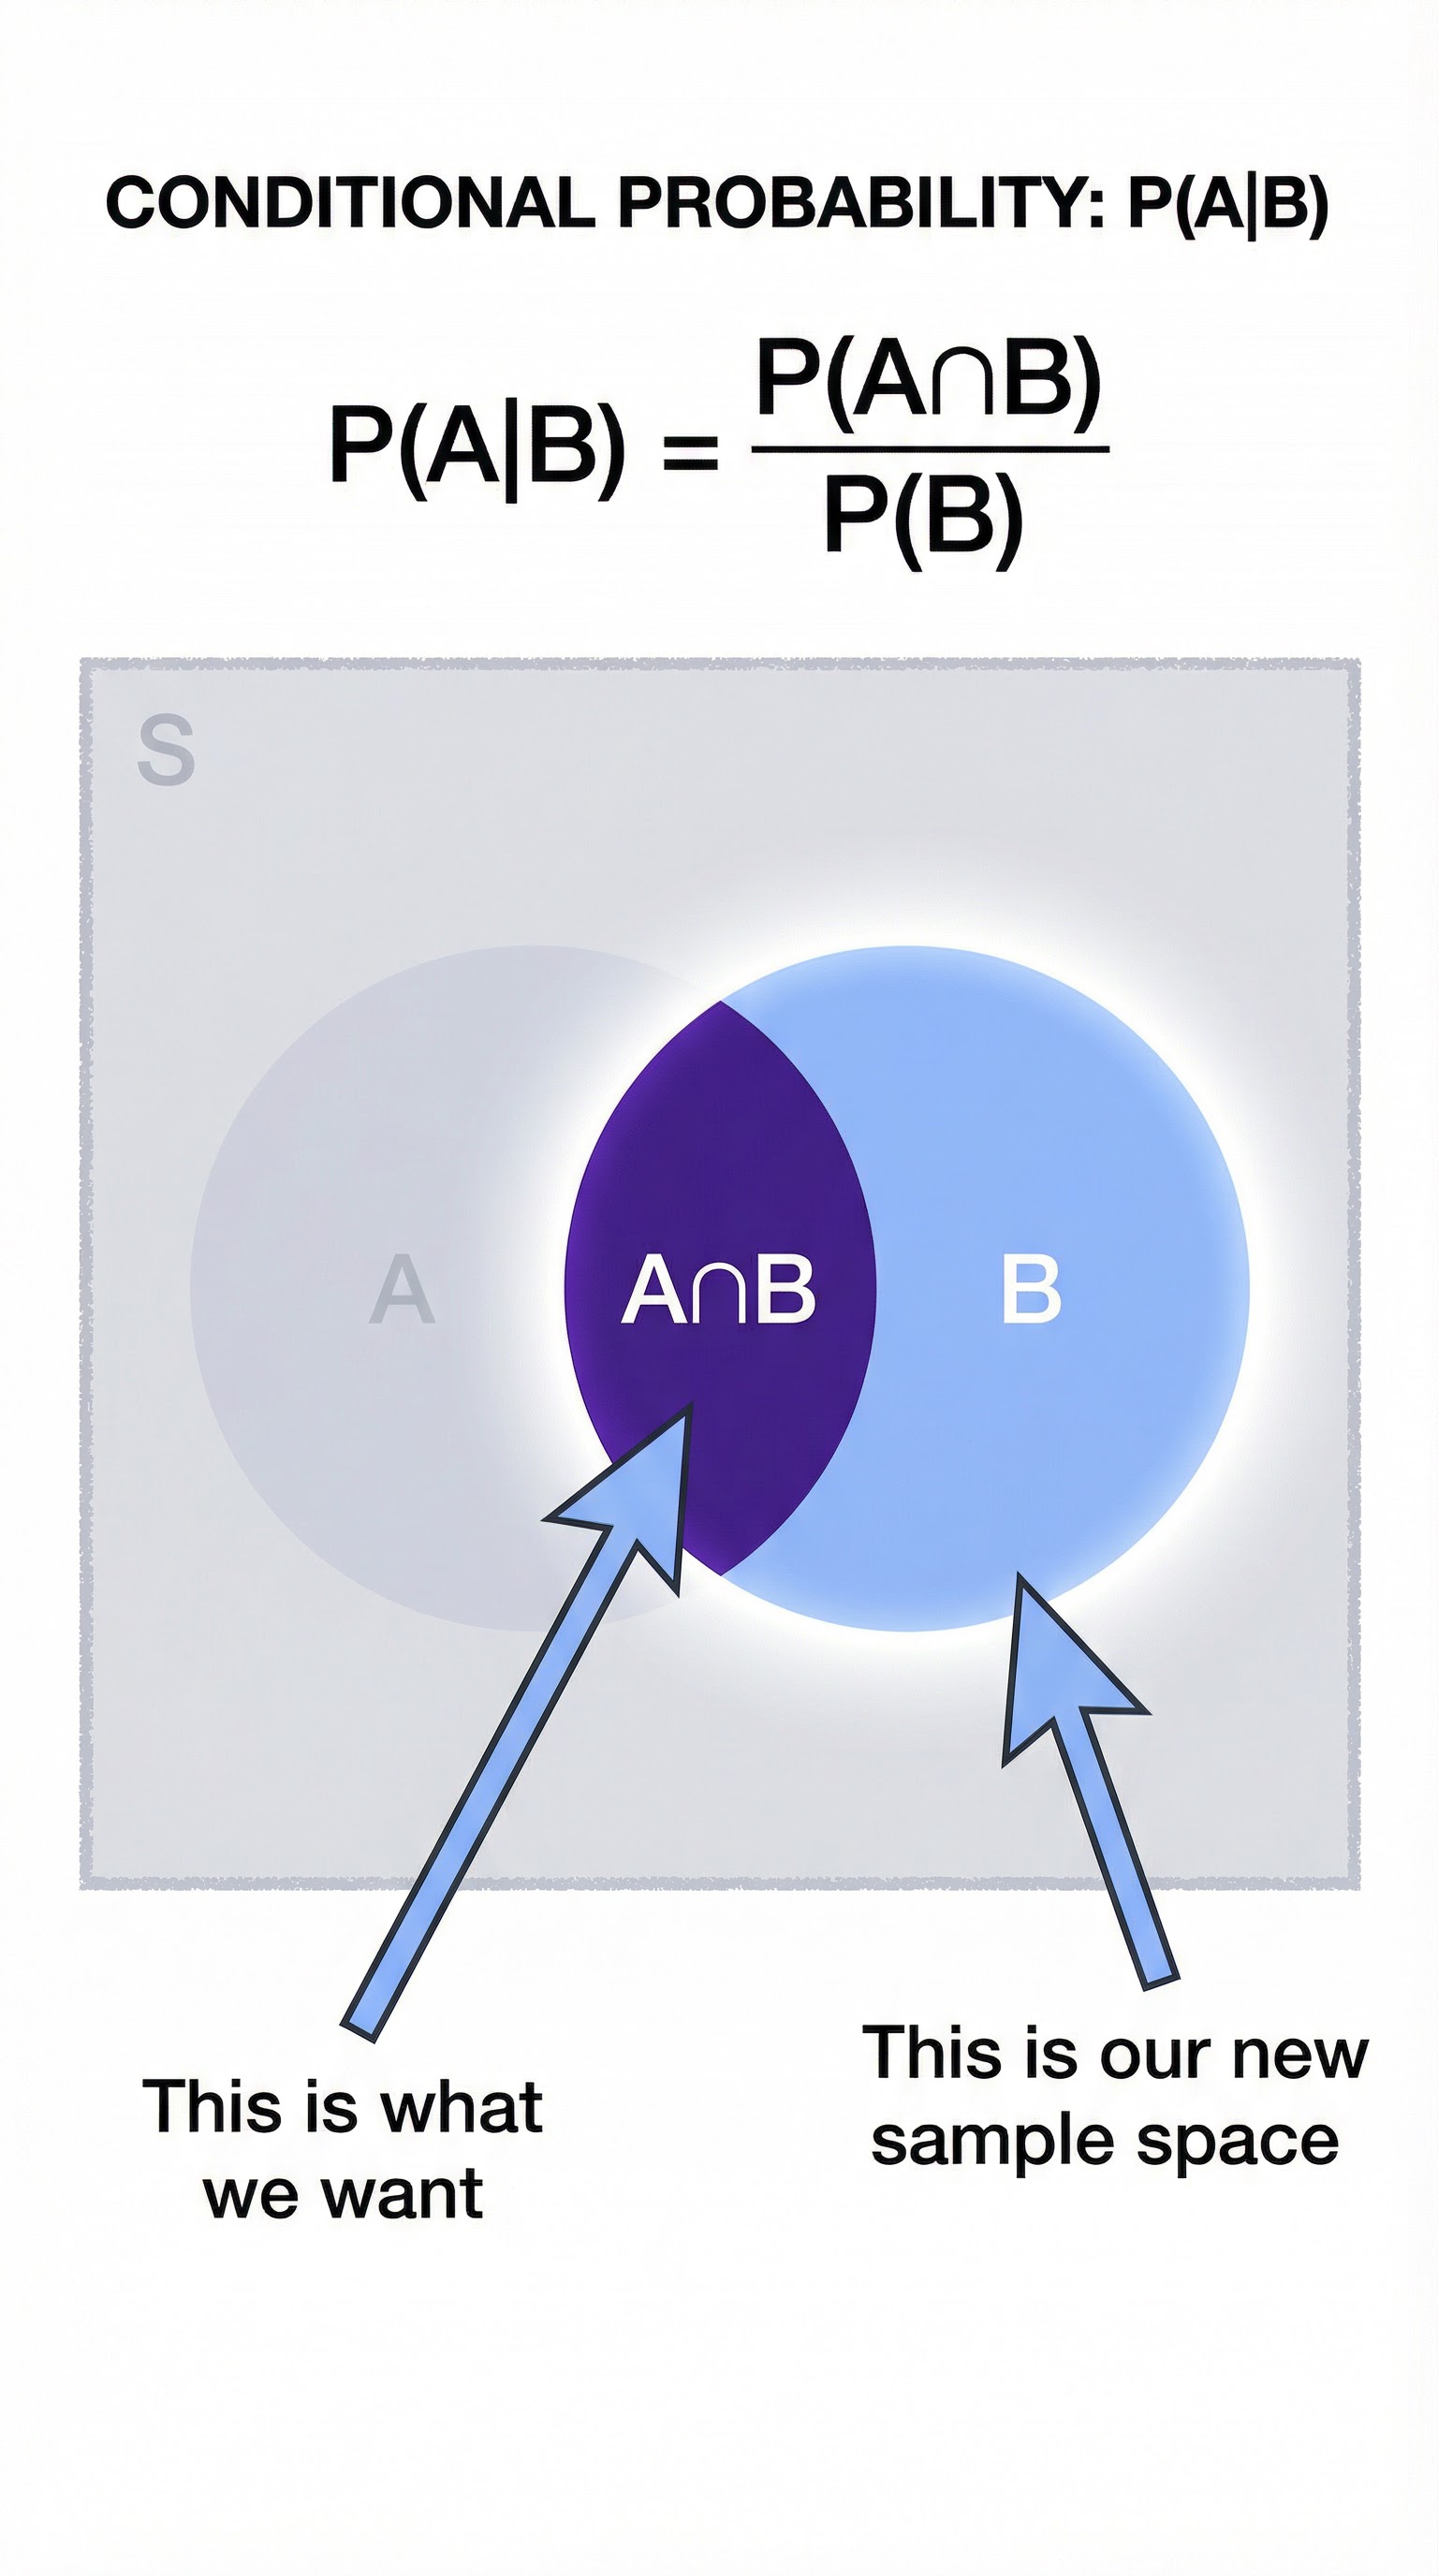
    The phrase 'given that' is your signal that you are dealing with conditional probability. It means you are working with a restricted sample space. The notation is P(A|B), which reads 'the probability of A given that B has occurred'.

    The formula is: **P(A|B) = P(A ∩ B) / P(B)**Think of it this way: you are no longer considering the entire sample space. You are now living in a world where event B has definitely happened. So, your new 'whole' is P(B). The part of that 'new whole' that you are interested in is the part that is also in A, which is the intersection P(A ∩ B). This is a high-level skill that examiners use to differentiate candidates.
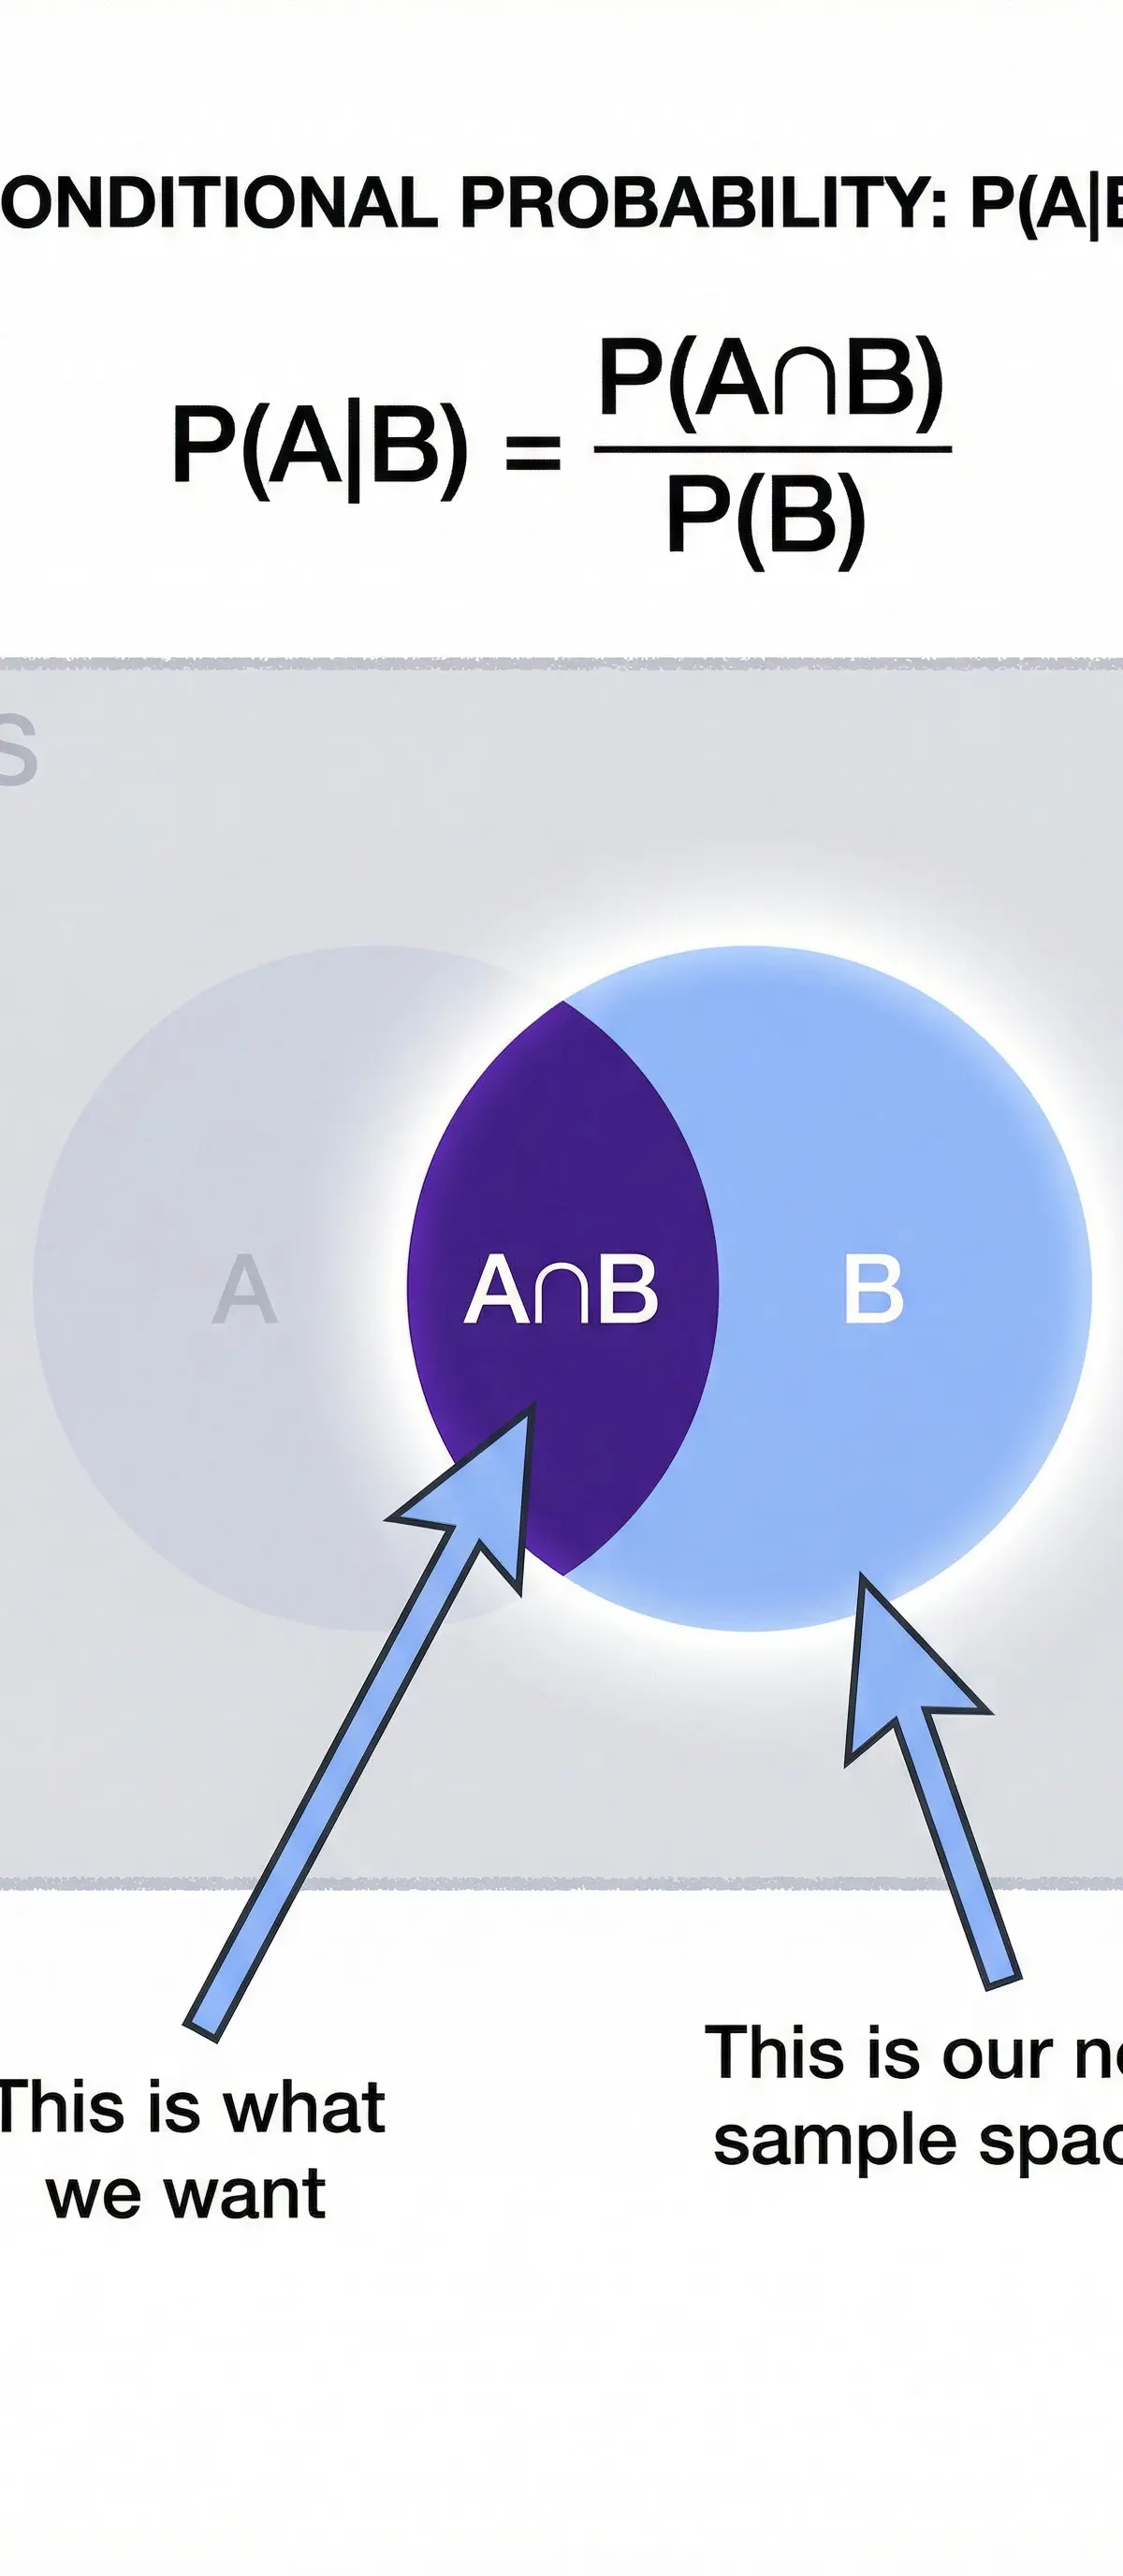
    Visual explanation of conditional probability P(A|B).

    Concept 4: Tree Diagrams

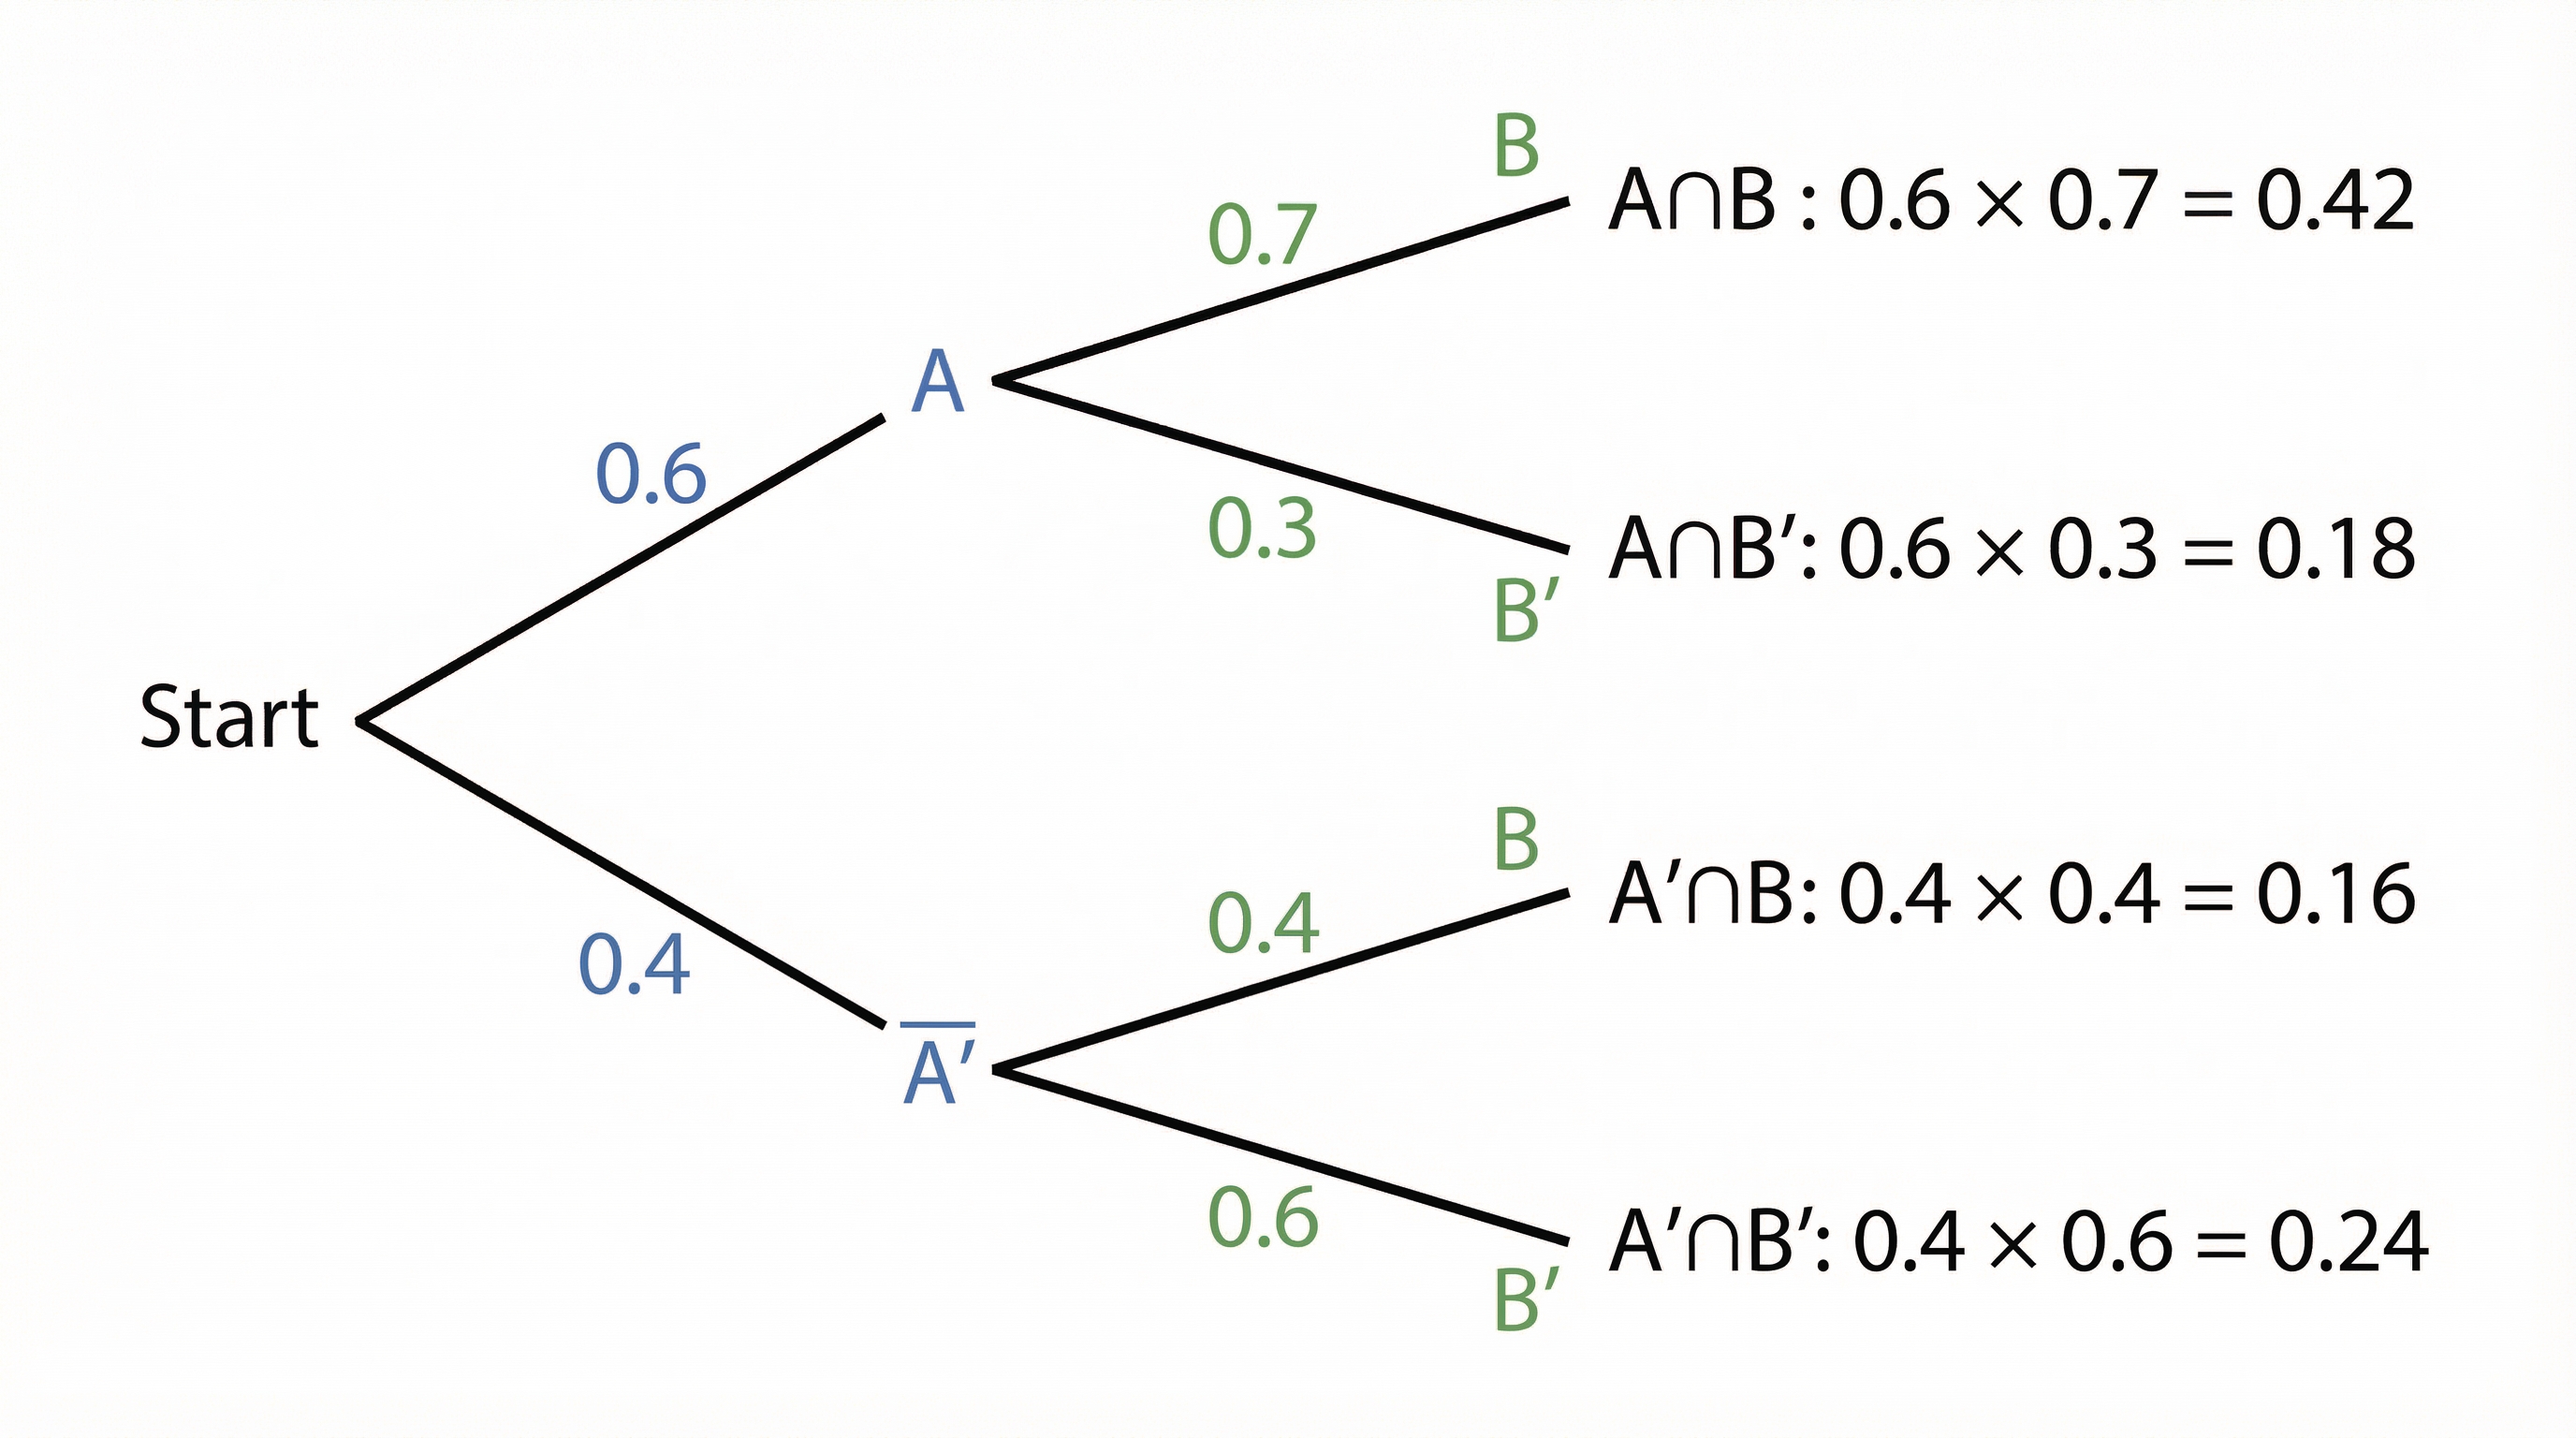
    Tree diagrams are your go-to tool for modelling experiments with multiple stages, especially when the probabilities change at each stage (known as 'without replacement').

    • Structure: The first set of branches represents the outcomes of the first stage. The second set of branches extends from the end of the first, representing the second stage.
    • Key Rules:
      1. Multiply along the branches to find the probability of a specific sequence of outcomes.
      2. Add down the list of final outcomes to find the overall probability of an event that can happen in multiple ways (e.g., picking one red and one blue counter in any order).
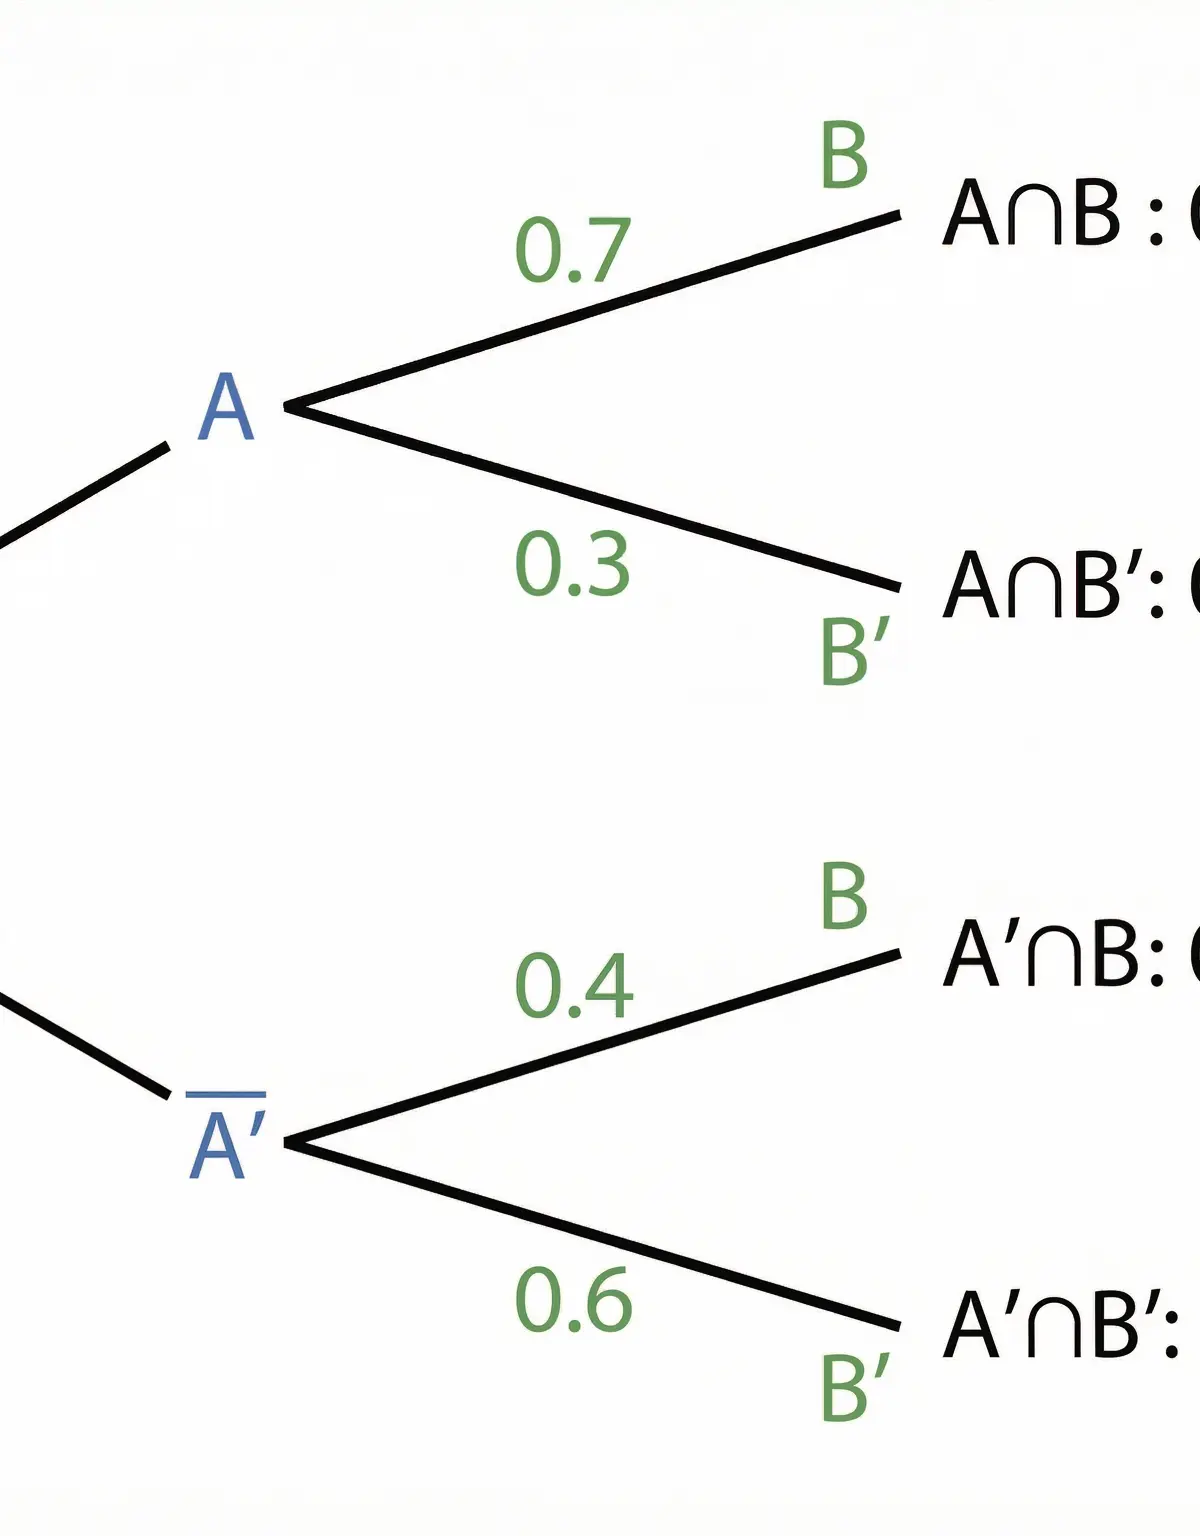
    A tree diagram illustrating a two-stage experiment without replacement.

    Mathematical/Scientific Relationships

    Here are the key formulas you will need. It is vital to know which are on the formula sheet and which you must memorise.

    • The Addition Rule (Given on formula sheet):
      P(A ∪ B) = P(A) + P(B) - P(A ∩ B)
      Use this when you want to find the probability of 'A or B' and the events are not mutually exclusive.

    • The Conditional Probability Formula (Given on formula sheet):
      P(A|B) = P(A ∩ B) / P(B)
      Use this whenever you see the phrase 'given that' or are dealing with a restricted sample space.

    • The Test for Independence (Must memorise):
      Events A and B are independent if and only if P(A ∩ B) = P(A) x P(B)
      This is not just a formula, but a test you must perform and conclude upon. You must calculate both sides separately and compare them.

    Practical Applications

    Probability is not just an abstract concept; it underpins many real-world systems:

    • Insurance: Companies use probability to calculate the likelihood of events like car accidents or house fires to set premium prices.
    • Medical Testing: The accuracy of a medical test is described using conditional probability – the probability of having a disease given a positive test result.
    • Finance and Investing: Analysts use probability to model the risk and potential return of different investments.
    • The Large Data Set: You will be expected to apply your knowledge of probability to analyse the real-world data provided by AQA, for example, by calculating the probability that a journey of a certain length occurs in a specific location.

    Visual Resources

    3 diagrams and illustrations
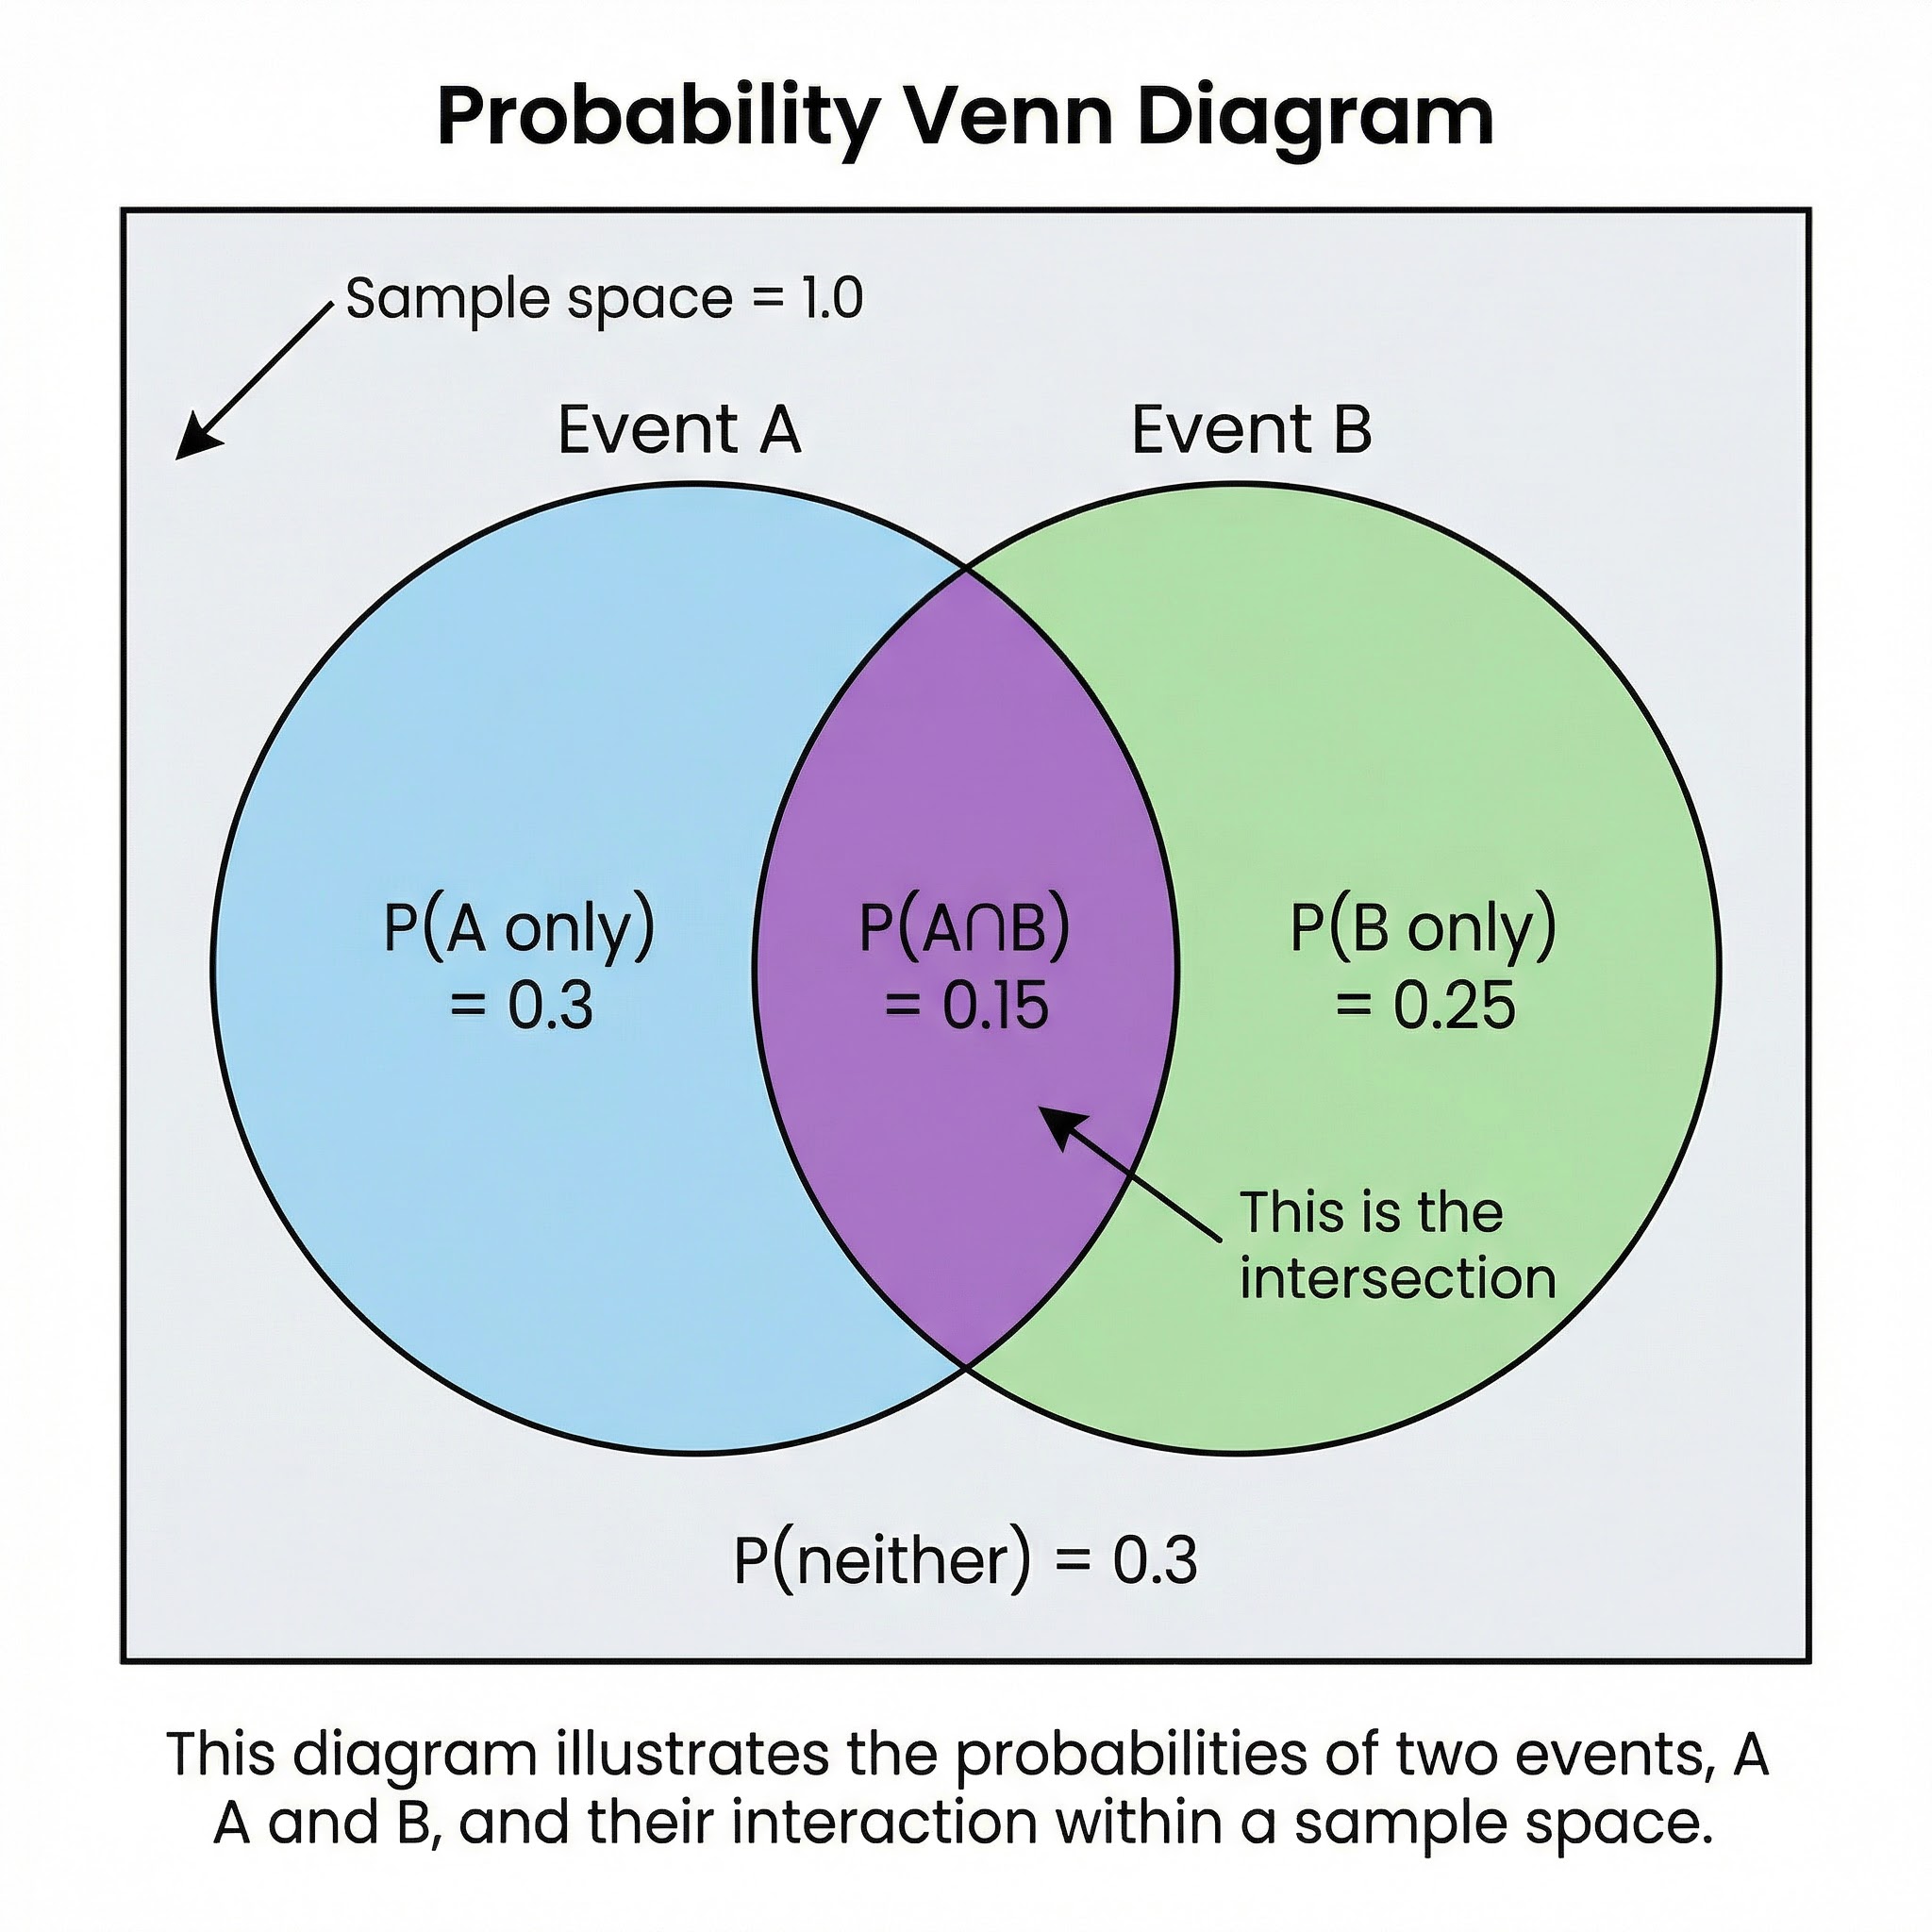
    A Venn diagram illustrating the probabilities of two events, A and B.
    A Venn diagram illustrating the probabilities of two events, A and B.
    A tree diagram illustrating a two-stage experiment without replacement.
    A tree diagram illustrating a two-stage experiment without replacement.
    Visual explanation of conditional probability P(A|B).
    Visual explanation of conditional probability P(A|B).

    Interactive Diagrams

    2 interactive diagrams to visualise key concepts

    A decision-making flowchart for choosing the correct probability tool.

    A sequence diagram illustrating the steps required to prove independence in an exam.

    Worked Examples

    3 detailed examples with solutions and examiner commentary

    Practice Questions

    Test your understanding — click to reveal model answers

    Q1

    Given that P(A) = 0.5, P(B) = 0.6 and P(A ∪ B) = 0.8. Find P(A|B).

    4 marks
    standard

    Hint: You need to find the intersection P(A ∩ B) first. Use the addition rule to rearrange for it.

    Q2

    A survey in a town showed that 70% of people own a car (C) and 45% own a bicycle (B). 25% own neither. Determine if the events 'owning a car' and 'owning a bicycle' are independent.

    6 marks
    challenging

    Hint: Start by drawing a Venn diagram. The area outside the circles is 0.25. What does that mean the union P(C ∪ B) must be?

    Q3

    State the two conditions that must be met for a series of trials to be modelled by a binomial distribution.

    2 marks
    foundation

    Hint: Think about what must be true for every single trial in the series.

    Q4

    A factory produces items, and 5% are defective. A quality check involves randomly selecting two items. What is the probability that at least one of the selected items is defective?

    3 marks
    standard

    Hint: 'At least one' is often easiest to solve by calculating '1 minus the probability of none'.

    Q5

    Explain the difference between mutually exclusive and independent events, using a real-world example for each.

    4 marks
    standard

    Hint: Define each term mathematically and then provide a simple, clear example.

    Explore this topic further

    View Topic PageAll Mathematics Topics

    Key Terms

    Essential vocabulary to know