Probability — OCR GCSE Study Guide
Exam Board: OCR | Level: GCSE
Master OCR GCSE Probability with this comprehensive guide. We break down everything from tree diagrams to conditional probability, providing examiner insights and multi-modal resources to help you secure top marks."
## Overview
Probability is a fundamental area of mathematics that deals with the likelihood of different outcomes occurring. For your OCR GCSE exam, this topic is not just about simple chance; it\'s about systematically modelling uncertainty in real-world situations. Examiners will test your ability to move fluently between different representations of probability, including fractions, decimals, and percentages. You will be expected to construct and interpret tree diagrams for successive events, use Venn diagrams to solve problems involving overlapping categories, and, for Higher tier candidates, tackle complex conditional probability. A strong grasp of this topic is crucial as it forms the basis for statistical analysis and connects to other areas of the syllabus, such as ratios and percentages, often appearing in multi-step, problem-solving questions worth significant marks.

## Key Concepts
### 1. The Probability Scale and Notation
Probability is always measured on a scale from 0 to 1. An event with a probability of 0 is **impossible**, while an event with a probability of 1 is **certain**. All other probabilities fall between these two values. It is critical to express your final answers in an acceptable format: a fraction, a decimal, or a percentage. **Examiners will not award marks for answers given as ratios (e.g., 1:4)**. The correct notation is P(Event), so the probability of rolling a 6 on a standard die is written as P(6) = 1/6.
### 2. Theoretical vs. Experimental Probability
**Theoretical probability** is calculated based on equally likely outcomes. For example, the theoretical probability of a fair coin landing on heads is 1/2. **Experimental probability** (or relative frequency) is an estimate based on the results of an experiment. It is calculated as:
`Relative Frequency = (Number of times the event occurs) / (Total number of trials)`
When a question is based on experimental data, you must use the word \'estimate\' in your answer to gain full credit, as it shows you understand the difference.
### 3. Combined Events: The AND and OR Rules
Examiners frequently ask questions involving multiple events. The key is to identify the relationship between them:
- **The AND Rule (for independent events)**: If you need Event A **AND** Event B to happen, you **multiply** their probabilities. For example, the probability of rolling a 6 AND flipping a head is P(6) * P(Head) = 1/6 * 1/2 = 1/12.
- **The OR Rule (for mutually exclusive events)**: If you need Event A **OR** Event B to happen, you **add** their probabilities. For example, the probability of rolling a 1 OR a 2 is P(1) + P(2) = 1/6 + 1/6 = 2/6.
### 4. Tree Diagrams
Tree diagrams are essential for visualising successive events, especially when probabilities change. Each set of branches represents an event, and the probabilities on branches from a single point must sum to 1. To find the probability of a specific sequence of outcomes, you **multiply** along the branches. To find the probability of two or more different sequences, you calculate each one separately and then **add** the results.
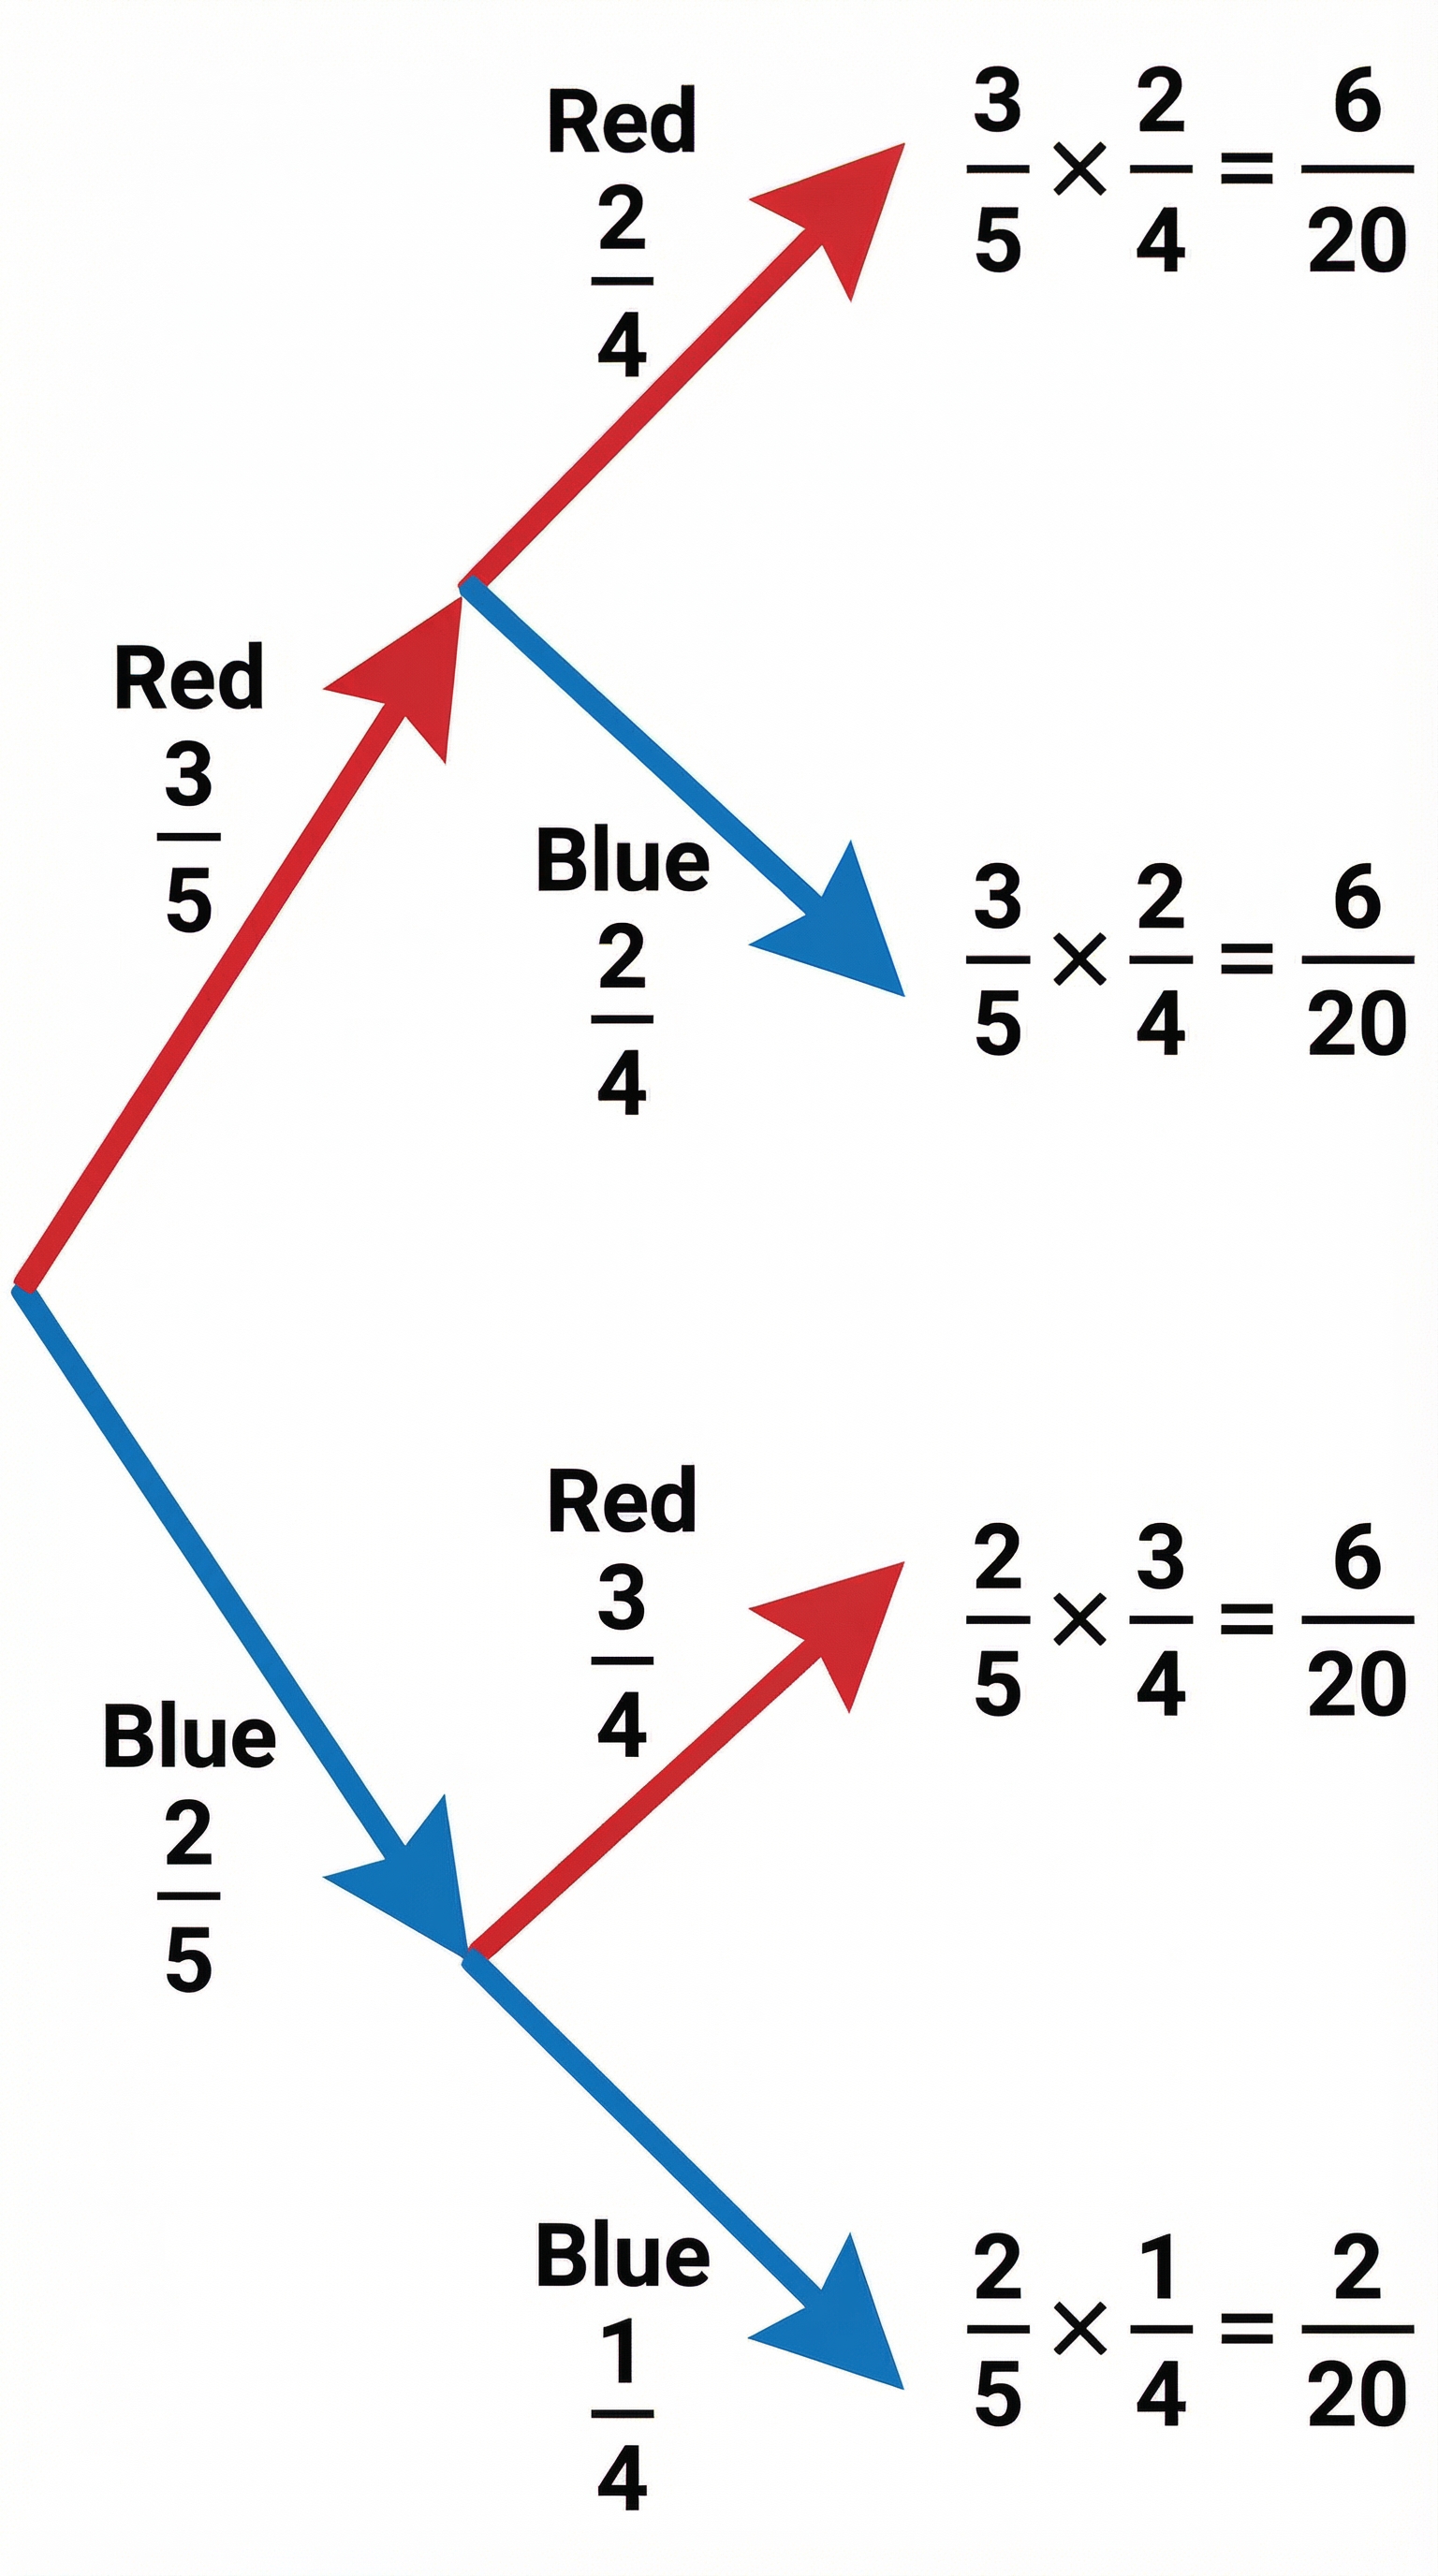
**Without Replacement**: A common Higher tier scenario involves selecting items \'without replacement\'. This means the total number of outcomes decreases for the second event, and the number of available items of a certain type also changes. This is known as **conditional probability** because the second event\'s probability depends on the first event\'s outcome.
### 5. Venn Diagrams
Venn diagrams are used to represent probabilities for overlapping events. The key regions are:
- **Intersection (A ∩ B)**: Represents A AND B. The items are in both sets.
- **Union (A ∪ B)**: Represents A OR B (or both). The items are in at least one of the sets.
- **Complement (A\')**: Represents NOT A. The items are outside of set A.
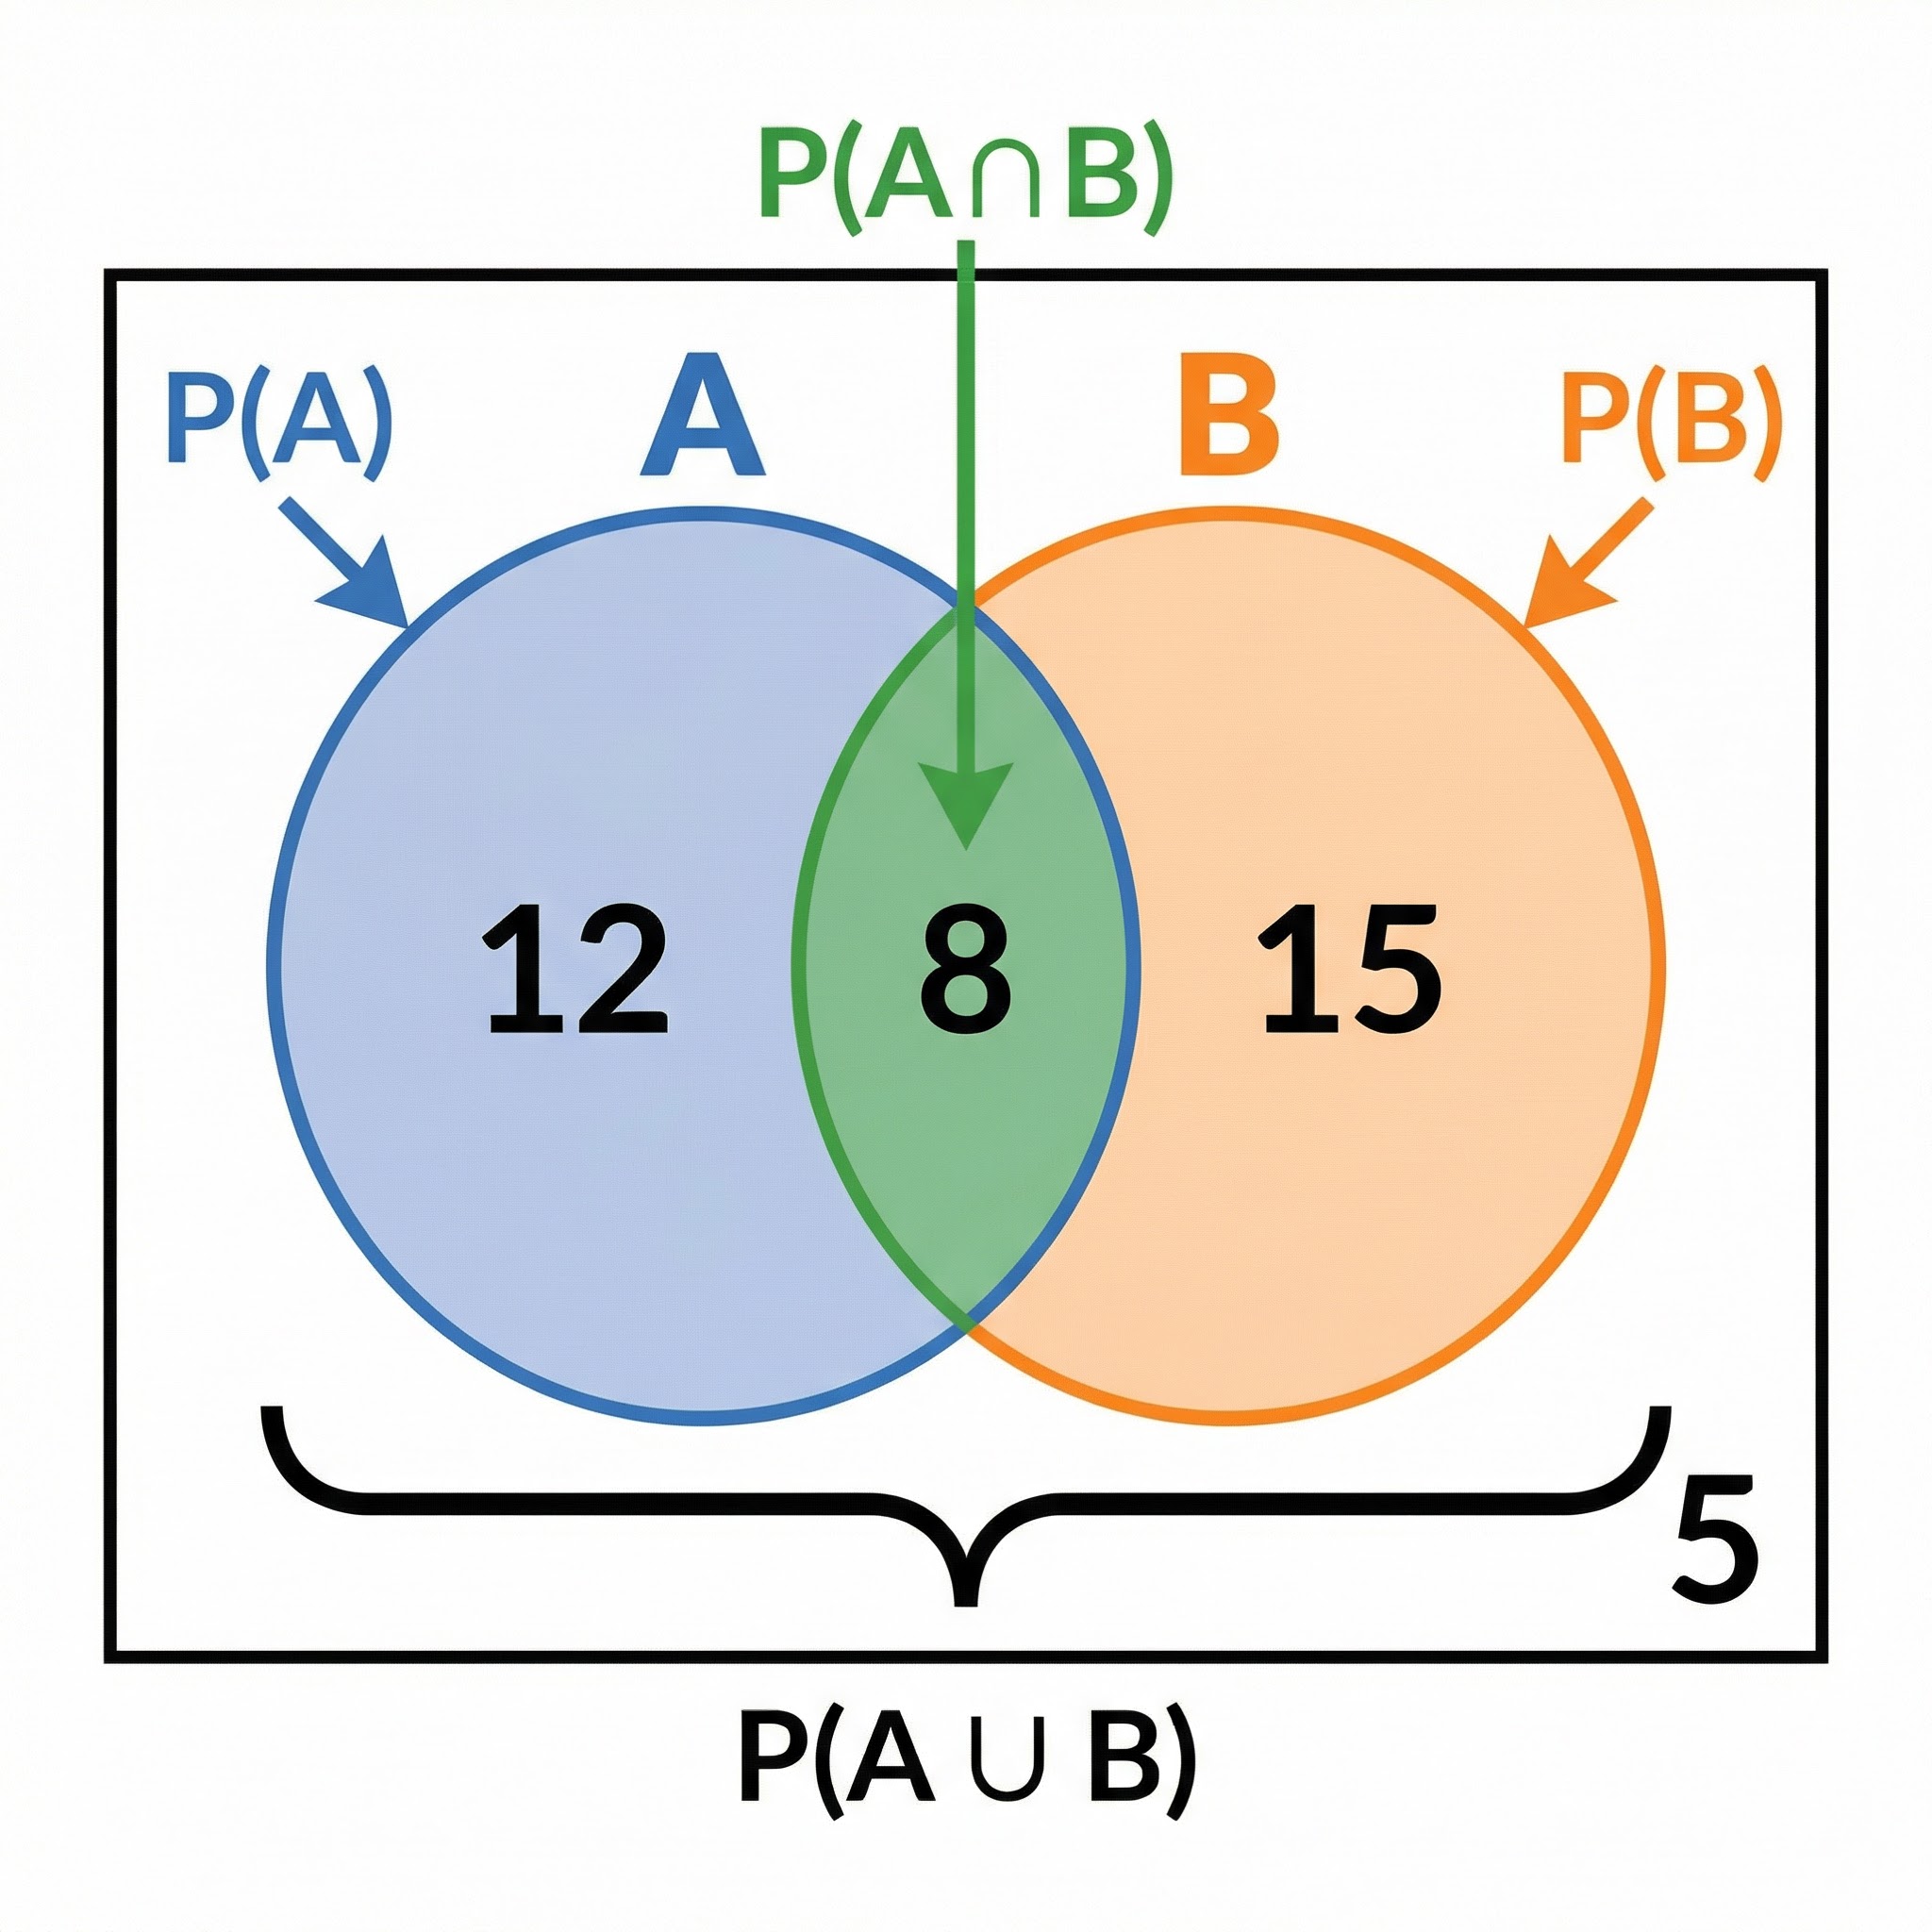
When calculating P(A ∪ B), a common error is to simply add P(A) and P(B), which double-counts the intersection. The correct formula is: `P(A ∪ B) = P(A) + P(B) - P(A ∩ B)`
## Mathematical/Scientific Relationships
- **Probability of an event**: `P(Event) = (Number of favourable outcomes) / (Total number of possible outcomes)` - **Must memorise**
- **Probability of an event NOT happening**: `P(Not A) = 1 - P(A)` - **Must memorise**
- **The AND Rule (Independent Events)**: `P(A and B) = P(A) * P(B)` - **Must memorise**
- **The OR Rule (Mutually Exclusive Events)**: `P(A or B) = P(A) + P(B)` - **Must memorise**
- **Conditional Probability Formula (Higher Tier)**: `P(A|B) = P(A ∩ B) / P(B)` - **Given on formula sheet**
## Practical Applications
Probability is not just an abstract concept; it\'s used everywhere. Insurance companies use it to calculate premiums by assessing the risk of events like car accidents or floods. Meteorologists use complex probabilistic models to forecast the weather. In medicine, probability is used to determine the effectiveness of new drugs during clinical trials. Understanding probability helps you make more informed decisions in everyday life, from playing board games to interpreting news statistics."