OCR · A-Level · Psychology
Course version: H567 · Version from Sept 2015
Estimate results (to include: commenting on the spread of scores for a set…
Full specification wording
D.0 – arithmetic and numerical computation: Estimate results (to include: commenting on the spread of scores for a set of data, which would require estimating the range)
Estimating is the habit of knowing roughly what a figure should be before and after you compute it, and the worked case here is spread.
- Point 3 of 3
- 4 key terms
Study notes
From the teaching notes for this specification point.
The idea
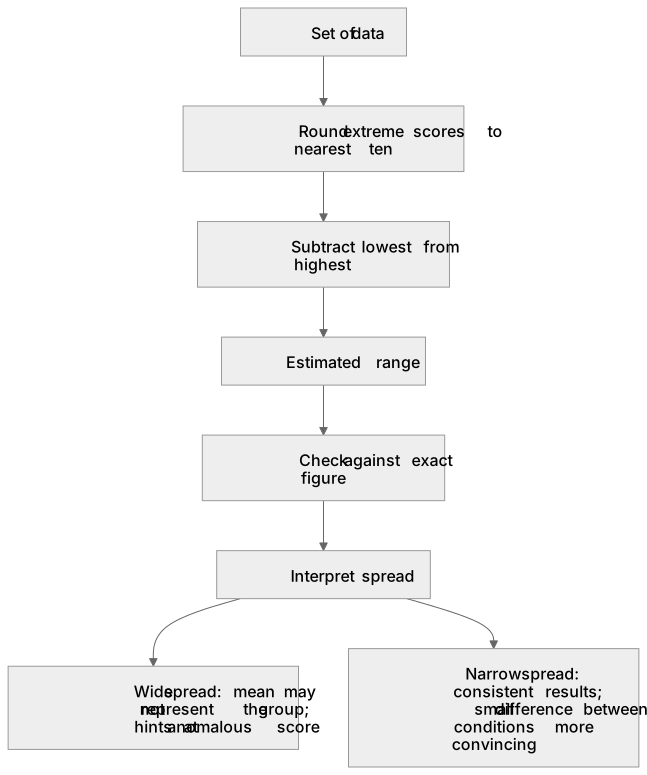
Estimating is the habit of knowing roughly what a figure should be before and after you compute it, and the worked case here is spread. The range is the largest score minus the smallest, a single number rather than a pair, and it can be read off a table in seconds, which is what makes it a quick check on a standard deviation or on a graph that looks wrong. Rounding each score to the nearest ten and taking the difference gives an estimate that should land close to the exact value, and when it does not the arithmetic is at fault. Interpretation is where the marks sit: a spread that is wide next to the mean warns that the mean represents nobody in particular and hints at an anomalous score, while a narrow one shows participants behaved alike and makes a small difference between conditions more convincing.
What earns the marks
- The range is credited as one value with its units, found as highest minus lowest, and quoted alongside the mean rather than in place of it.
- An estimate earns credit when it is justified, for example by rounding the extreme scores to the nearest ten before subtracting, and then checked against the exact figure.
- Comment marks are for interpretation, so say that a wide spread means the scores varied greatly and the mean may not represent the group, and that a narrow spread means a consistent set of results.
- The standard evaluative point is rewarded: the range uses only two scores and is distorted by a single extreme value, whereas the standard deviation uses every score.
Common mistakes and how to put them right
Writing the range as an interval, for example from 12 to 30, when the range is one number, here 18.
Forgetting that the two extreme scores alone set the range, so one participant scoring near zero can make two very different data sets look equally variable.
Presenting an eyeballed estimate as the calculated answer with no working, which loses the method mark even when the number happens to be close.
Exam tips
- Estimation items usually appear as a short comment on a printed table, so scan the top and bottom of the column first and state the spread before discussing anything else.
- When asked to comment on the spread, do not stop at the number; say what it implies for how well the mean represents the sample.
- If invited to suggest a better measure of dispersion, name the standard deviation and give the reason, because the name alone rarely earns the second mark.
Try the lesson
The start of the D.0 – arithmetic and numerical computation: Estimate results (to include: commenting on the spread of scores for a set of data, which would require estimating the range) lesson, made from teaching notes for this specification point.
Have a go first
A psychologist records the following reaction times in milliseconds: 19, 41, 88, 23, 91, 18. By rounding to the nearest ten, what is the estimated range of this data?
Listen
Estimating is the habit of knowing roughly what a figure should be before and after you compute it, and the worked case here is spread. The range is the largest score minus the smallest, a single number rather than a pair, and it can be read off a table in seconds, which is what makes it a quick check on a standard deviation or on a graph that looks wrong. Rounding each score to the nearest ten and taking the difference gives an estimate that should land close to the exact value, and when it does not the arithmetic is at fault. Interpretation is where the marks sit: a spread that is wide next to the mean warns that the mean represents nobody in particular and hints at an anomalous score, while a narrow one shows participants behaved alike and makes a small difference between conditions more convincing. A strong answer earns marks for these points. The range is credited as one value with its units, found as highest minus lowest, and quoted alongside the mean rather than in place of it. An estimate earns credit when it is justified, for example by rounding the extreme scores to the nearest ten before subtracting, and then checked against the exact figure. Comment marks are for interpretation, so say that a wide spread means the scores varied greatly and the mean may not represent the group, and that a narrow spread means a consistent set of results. The standard evaluative point is rewarded: the range uses only two scores and is distorted by a single extreme value, whereas the standard deviation uses every score. Exam tip: Estimation items usually appear as a short comment on a printed table, so scan the top and bottom of the column first and state the spread before discussing anything else.
See it
Key words
Say what each word means before you turn the card.
range as a measure of dispersion
Try answering aloud or in your head before turning the card.
anomalous scores
Try answering aloud or in your head before turning the card.
estimation as a check on calculation
Try answering aloud or in your head before turning the card.
reporting a mean with spread
Try answering aloud or in your head before turning the card.
See every definition
- range as a measure of dispersion
- The largest score minus the smallest, a single number rather than a pair, which can be read off a table in seconds.
- anomalous scores
- A single extreme value that distorts the range, because the two extreme scores alone set it.
- estimation as a check on calculation
- Rounding each score to the nearest ten and taking the difference gives an estimate that should land close to the exact value, and when it does not the arithmetic is at fault.
- reporting a mean with spread
- The range is quoted alongside the mean rather than in place of it, and a wide spread warns that the mean represents nobody in particular.
Label the diagram
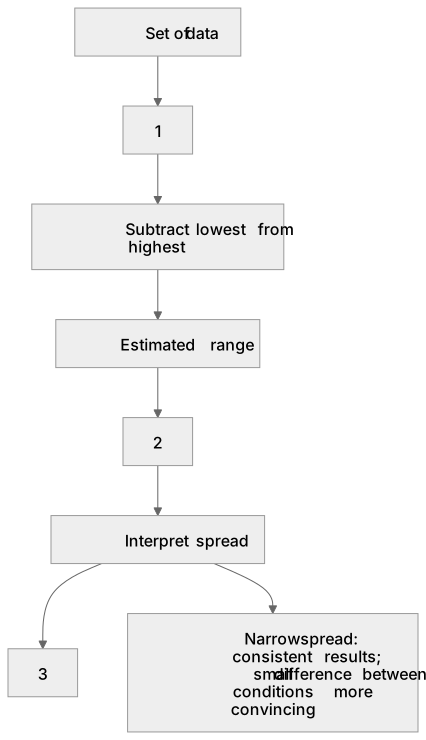
Some boxes have lost their names. Pick the right name for each number.
1Box 1
2Box 2
3Box 3
There is more to this lesson
The full lesson goes on to check your understanding and help you earn the marks. Create a free account to carry on, with your progress saved.
A week of Premium from your first lesson · Then the free plan continues · No card, no charge
Test your understanding of D.0 – arithmetic and numerical computation: Estimate results (to include: commenting on the spread of scores for a set of data, which would require estimating the range)
Active recall beats re-reading. Take an instant quiz now to test what you’ve learned and lock it into long-term memory.
A week of Premium from your first lesson · Then the free plan continues · No card, no charge