OCR · A-Level · Psychology
Course version: H567 · Version from Sept 2015
Plot two variables from experimental or other data (to include: sketching…
Full specification wording
D.3 – graphs: Plot two variables from experimental or other data (to include: sketching a scatter diagram using two sets of data from a correlational investigation)
Plotting two variables allows psychologists to visually analyse experimental or correlational data.
- Point 2 of 2
- 2 key terms
Study notes
From the teaching notes for this specification point.
The idea
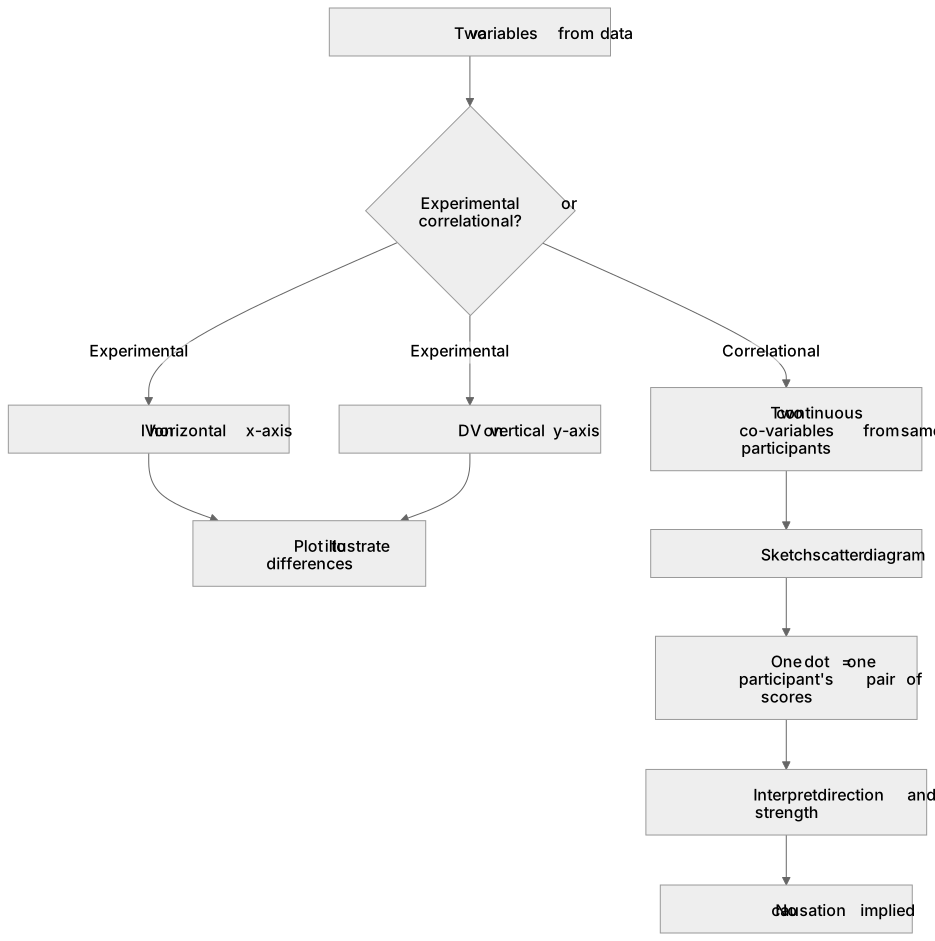
Plotting two variables allows psychologists to visually analyse experimental or correlational data. For experimental data, the independent variable is plotted on the horizontal x-axis and the dependent variable on the vertical y-axis to illustrate differences. Conversely, correlational data requires sketching a scatter diagram using two sets of continuous co-variables from the same participants. Each dot represents one participant's scores on both variables. For example, plotting revision hours against exam scores reveals the relationship's direction and strength. Unlike experimental graphs, scatter diagrams do not imply causation, as unmeasured third variables might influence both co-variables.
What earns the marks
- Accurately plotting experimental data by placing the manipulated independent variable on the x-axis and the measured dependent variable on the y-axis.
- Sketching a scatter diagram by plotting two sets of continuous co-variables from a correlational investigation, ensuring one dot represents one participant's pair of scores.
- Labelling both axes clearly with the variable names and appropriate units of measurement, maintaining a consistent and even scale on each axis.
- Interpreting the resulting scatter diagram to determine the direction (positive or negative) and strength (strong, moderate, or weak) of the relationship between the two variables.
Common mistakes and how to put them right
Joining the dots on a scatter diagram with a line.
Put it right: Leave the dots unconnected or draw a single straight line of best fit to represent the overall trend.
Confusing the axes when plotting experimental data.
Put it right: Place the independent variable (IV) on the horizontal x-axis and the dependent variable (DV) on the vertical y-axis.
Using causal language when describing a scatter diagram.
Put it right: Use terms like 'relationship' or 'association' rather than 'causes' or 'effects', as correlational data cannot establish cause and effect.
Exam tips
- When asked to sketch a scatter diagram, focus on accurate axis labels, an even scale, and a plausible pattern of dots rather than plotting exact coordinates perfectly.
- Always check whether the data is experimental or correlational before plotting; this determines whether you should draw a bar chart, line graph, or a scatter diagram.
Try the lesson
The start of the D.3 – graphs: Plot two variables from experimental or other data (to include: sketching a scatter diagram using two sets of data from a correlational investigation) lesson, made from teaching notes for this specification point.
Have a go first
A psychologist is investigating the relationship between the number of hours participants sleep and their reaction time in milliseconds. How should these two variables be plotted to sketch a scatter diagram?
Listen
Plotting two variables allows psychologists to visually analyse experimental or correlational data. For experimental data, the independent variable is plotted on the horizontal x-axis and the dependent variable on the vertical y-axis to illustrate differences. Conversely, correlational data requires sketching a scatter diagram using two sets of continuous co-variables from the same participants. Each dot represents one participant's scores on both variables. For example, plotting revision hours against exam scores reveals the relationship's direction and strength. Unlike experimental graphs, scatter diagrams do not imply causation, as unmeasured third variables might influence both co-variables. A strong answer earns marks for these points. Accurately plotting experimental data by placing the manipulated independent variable on the x-axis and the measured dependent variable on the y-axis. Sketching a scatter diagram by plotting two sets of continuous co-variables from a correlational investigation, ensuring one dot represents one participant's pair of scores. Labelling both axes clearly with the variable names and appropriate units of measurement, maintaining a consistent and even scale on each axis. Interpreting the resulting scatter diagram to determine the direction (positive or negative) and strength (strong, moderate, or weak) of the relationship between the two variables. A common slip: Joining the dots on a scatter diagram with a line. Instead, leave the dots unconnected or draw a single straight line of best fit to represent the overall trend. Exam tip: When asked to sketch a scatter diagram, focus on accurate axis labels, an even scale, and a plausible pattern of dots rather than plotting exact coordinates perfectly.
See it
Key words
Say what each word means before you turn the card.
experimental vs correlational data
Try answering aloud or in your head before turning the card.
scatter diagrams
Try answering aloud or in your head before turning the card.
See every definition
- experimental vs correlational data
- Experimental data is plotted with the independent variable on the horizontal x-axis and the dependent variable on the vertical y-axis, whereas correlational data requires sketching a scatter diagram using two sets of continuous co-variables.
- scatter diagrams
- A sketch plotting two sets of continuous co-variables from the same participants, where each dot represents one participant's scores on both variables.
There is more to this lesson
The full lesson goes on to check your understanding and help you earn the marks. Create a free account to carry on, with your progress saved.
A week of Premium from your first lesson · Then the free plan continues · No card, no charge
Test your understanding of D.3 – graphs: Plot two variables from experimental or other data (to include: sketching a scatter diagram using two sets of data from a correlational investigation)
Active recall beats re-reading. Take an instant quiz now to test what you’ve learned and lock it into long-term memory.
A week of Premium from your first lesson · Then the free plan continues · No card, no charge