OCR · A-Level · Psychology
Course version: H567 · Version from Sept 2015
Inferential statistics: normal distribution curves; skewed distribution…
Full specification wording
Data recording, analysis and presentation: Inferential statistics: normal distribution curves; skewed distribution curves; probability; significance levels; using statistical tables of critical values; criteria for using a parametric test; criteria for using a specific non-parametric inferential test (Mann-Whitney U test, Wilcoxon Signed Ranks test, Chi-square, Binomial Sign test and Spearman’s Rho); understand the use of specific non-parametric inferential tests (Mann-Whitney U test, Wilcoxon Signed Ranks test, Chi-square, Binomial Sign test and Spearman’s Rho); type 1 errors; type 2 errors; symbols: =, <, <<, >>, >, ∝, ~.
An inferential test asks how likely a result is if the null hypothesis is true, accepting a probability of 0.05, or 0.01 if a false claim is costly.
- Point 5 of 6
- 4 key terms
Study notes
From the teaching notes for this specification point.
The idea
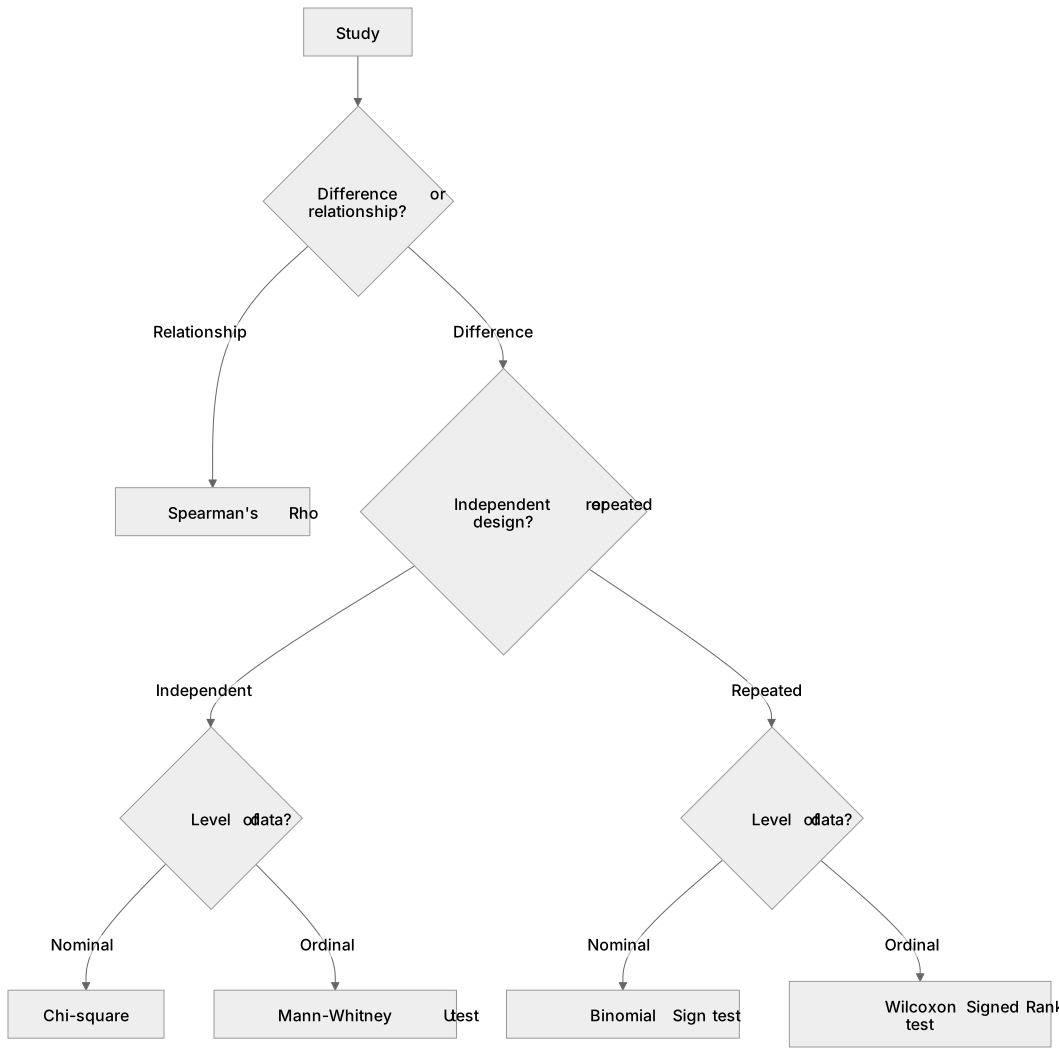
An inferential test asks how likely a result is if the null hypothesis is true, accepting a probability of 0.05, or 0.01 if a false claim is costly. Test choice depends on: difference or relationship, independent or repeated design, and level of data. Chi-square takes nominal independent data, binomial sign takes nominal repeated, Mann-Whitney takes ordinal independent, Wilcoxon takes ordinal repeated, and Spearman correlates ranks. Parametric tests require interval data, normal distribution and similar variance. Decisions use critical value tables read for sample size, tails and significance level. Mathematical symbols (=, <, <<, >>, >, ∝, ~) express these relationships, while normal and skewed distribution curves illustrate data spread.
What earns the marks
- State the accepted probability as 0.05, meaning a result this extreme would arise by chance about five times in a hundred, with a stricter 0.01 used where a false positive would be serious.
- A parametric test requires interval data, a roughly normal distribution and similar variance across conditions, and is preferred when those hold because it is more likely to detect a real effect.
- Define and use mathematical symbols accurately: = (equals), < (less than), << (much less than), >> (much greater than), > (greater than), ∝ (proportional to), and ~ (approximately) when reporting statistical findings.
Common mistakes and how to put them right
Getting the direction of the comparison backwards, which is the costliest error here, because a Mann-Whitney value larger than the critical value is not significant however tidy the arithmetic.
Reading the table at the wrong number of tails, when a one-tailed value may be used only where the hypothesis states the direction of the effect.
Writing that the results prove the hypothesis, when a significant result means the null hypothesis is rejected at a stated probability and nothing stronger.
Mixing up the two errors, or describing a type 1 error as rejecting a true finding.
Choosing a parametric test on ranked data because it sounds more impressive, when the criteria have not been met.
Misinterpreting mathematical symbols, such as confusing < (less than) with > (greater than) when reporting significance levels.
Exam tips
- Test choice questions almost always ask you to justify the choice, so give the level of data and the design rather than only the name of the test.
- Given a calculated and a critical value, write the comparison, the decision about the null hypothesis and the probability level in one sentence, because those are usually three separate marks.
- Scenarios sometimes describe data that break the parametric criteria deliberately, so check the level and the shape of the distribution before recommending one.
Try the lesson
The start of the Data recording, analysis and presentation: Inferential statistics: normal distribution curves; skewed distribution curves; probability; significance levels; using statistical tables of critical values; criteria for using a parametric test; criteria for using a specific non-parametric inferential test (Mann-Whitney U test, Wilcoxon Signed Ranks test, Chi-square, Binomial Sign test and Spearman’s Rho); understand the use of specific non-parametric inferential tests (Mann-Whitney U test, Wilcoxon Signed Ranks test, Chi-square, Binomial Sign test and Spearman’s Rho); type 1 errors; type 2 errors; symbols: =, <, <<, >>, >, ∝, ~. lesson, made from teaching notes for this specification point.
Have a go first
A researcher is investigating whether there is a difference in the self-reported stress levels (measured on an ordinal scale from 1 to 10) between two independent groups of students. Which inferential statistical test should be used to analyse this data?
Listen
An inferential test asks how likely a result is if the null hypothesis is true, accepting a probability of 0.05, or 0.01 if a false claim is costly. Test choice depends on: difference or relationship, independent or repeated design, and level of data. Chi-square takes nominal independent data, binomial sign takes nominal repeated, Mann-Whitney takes ordinal independent, Wilcoxon takes ordinal repeated, and Spearman correlates ranks. Parametric tests require interval data, normal distribution and similar variance. Decisions use critical value tables read for sample size, tails and significance level. Mathematical symbols (=, >, >, ∝, ~) express these relationships, while normal and skewed distribution curves illustrate data spread. A strong answer earns marks for these points. State the accepted probability as 0.05, meaning a result this extreme would arise by chance about five times in a hundred, with a stricter 0.01 used where a false positive would be serious. Choose the test from three features of the study: difference or relationship, independent or repeated design, and level of data. Chi-square takes nominal unrelated data, the binomial sign test nominal related data, Mann-Whitney ordinal unrelated data, Wilcoxon ordinal related data, and Spearman a correlation of ranked scores. A parametric test requires interval data, a roughly normal distribution and similar variance across conditions, and is preferred when those hold because it is more likely to detect a real effect. Compare the calculated value with the critical value taken from the table for the sample size or degrees of freedom, the number of tails and the level chosen. Mann-Whitney, Wilcoxon and the sign test are significant when the calculated value is the same as or smaller than the critical value, while chi-square and Spearman are significant when the absolute calculated value is the same as or larger than the critical value. Exam tip: Test choice questions almost always ask you to justify the choice, so give the level of data and the design rather than only the name of the test.
See it
Key words
Say what each word means before you turn the card.
significance levels
Try answering aloud or in your head before turning the card.
critical values
Try answering aloud or in your head before turning the card.
test selection
Try answering aloud or in your head before turning the card.
type 1 and type 2 errors
Try answering aloud or in your head before turning the card.
See every definition
- significance levels
- The accepted probability is 0.05, meaning a result this extreme would arise by chance about five times in a hundred, with a stricter 0.01 used where a false positive would be serious.
- critical values
- Values taken from a table for the sample size or degrees of freedom, the number of tails and the level chosen, with which the calculated value is compared.
- test selection
- Choosing the test from three features of the study: difference or relationship, independent or repeated design, and level of data.
- type 1 and type 2 errors
- Accepting a difference that is not really there, made more likely by a lenient level, and missing a real one, made more likely by a strict level, where tightening one raises the other.
There is more to this lesson
The full lesson goes on to check your understanding and help you earn the marks. Create a free account to carry on, with your progress saved.
A week of Premium from your first lesson · Then the free plan continues · No card, no charge
Test your understanding of Data recording, analysis and presentation: Inferential statistics: normal distribution curves; skewed distribution curves; probability; significance levels; using statistical tables of critical values; criteria for using a parametric test; criteria for using a specific non-parametric inferential test (Mann-Whitney U test, Wilcoxon Signed Ranks test, Chi-square, Binomial Sign test and Spearman’s Rho); understand the use of specific non-parametric inferential tests (Mann-Whitney U test, Wilcoxon Signed Ranks test, Chi-square, Binomial Sign test and Spearman’s Rho); type 1 errors; type 2 errors; symbols: =, <, <<, >>, >, ∝, ~.
Active recall beats re-reading. Take an instant quiz now to test what you’ve learned and lock it into long-term memory.
A week of Premium from your first lesson · Then the free plan continues · No card, no charge