OCR · A-Level · Psychology
Course version: H567 · Version from Sept 2015
Learners should be able to demonstrate knowledge and understanding of the…
Full specification wording
Data recording, analysis and presentation: Learners should be able to demonstrate knowledge and understanding of the process and procedures involved in the collection, analysis and presentation of data. This will necessitate the ability to perform some calculations (please see Appendix 5b for examples of mathematical requirements).
Data handling involves collection, analysis, and presentation.
- Point 1 of 6
- 4 key terms
Study notes
From the teaching notes for this specification point.
The idea
Data handling involves collection, analysis, and presentation. Collection procedures include sampling methods, designing questionnaires, or conducting observations. Data analysis follows a logical sequence: record raw scores, identify the level of measurement, summarise using descriptive statistics, present findings in a suitable graph, and select an inferential test to interpret against a critical value. Mathematical demands include calculating percentages, fractions, ratios, mean, median, mode, and range, converting between standard and decimal form, and rounding to significant figures. Loftus and Palmer (1974) illustrates this: Experiment 1 calculated mean speed estimates across five verb conditions, while Experiment 2 tallied 'yes'/'no' broken glass responses across three conditions into a frequency table, analysed using a chi-square test.
What earns the marks
- Describe data collection procedures, such as selecting a sample, designing self-report measures, or setting up observational categories.
- Outline the data analysis sequence: record raw scores, identify the level of measurement, calculate descriptive statistics, draw a graph, and conduct an inferential test.
- Perform required calculations accurately, including percentages, fractions, ratios, measures of central tendency and dispersion, standard/decimal conversions, and significant figures.
- Interpret statistical findings by explaining what the calculated figure reveals about the participants or the research hypothesis, as interpretation earns significant credit.
- Anchor analysis to core studies: Loftus and Palmer (1974) calculated means for speed estimates (Exp 1) and used a chi-square test for nominal broken glass data across three conditions (Exp 2).
- When drawing a graph, ensure both axes are accurately labelled with the variable and its unit, and provide a clear, descriptive title.
Common mistakes and how to put them right
Conflating Loftus and Palmer's experiments.
Put it right: Experiment 1 had five verb conditions and measured mean speed, while Experiment 2 had three conditions and used chi-square for broken glass reports.
Giving an answer to more decimal places than the raw data justify or rounding prematurely.
Put it right: Only round at the final step of a calculation to maintain accuracy.
Describing a graph by merely reading numbers off it.
Put it right: State the overall pattern or trend and explain what it means for the hypothesis.
Reporting a statistic without a conclusion.
Put it right: Link the calculated figure back to the context of the study and the hypothesis.
Exam tips
- Always show your working for calculations; method marks can often be awarded even if a minor arithmetic slip leads to an incorrect final answer.
- A calculation question is frequently followed by an explanation question on the same data, so ensure you understand what your calculated figure represents in context.
Try the lesson
The start of the Data recording, analysis and presentation: Learners should be able to demonstrate knowledge and understanding of the process and procedures involved in the collection, analysis and presentation of data. This will necessitate the ability to perform some calculations (please see Appendix 5b for examples of mathematical requirements). lesson, made from teaching notes for this specification point.
Have a go first
A psychologist collects the following scores on a memory test from five participants: 4, 7, 9, 12, and 18. What is the mean score for this dataset?
Listen
Data handling involves collection, analysis, and presentation. Collection procedures include sampling methods, designing questionnaires, or conducting observations. Data analysis follows a logical sequence: record raw scores, identify the level of measurement, summarise using descriptive statistics, present findings in a suitable graph, and select an inferential test to interpret against a critical value. Mathematical demands include calculating percentages, fractions, ratios, mean, median, mode, and range, converting between standard and decimal form, and rounding to significant figures. Loftus and Palmer (1974) illustrates this: Experiment 1 calculated mean speed estimates across five verb conditions, while Experiment 2 tallied 'yes'/'no' broken glass responses across three conditions into a frequency table, analysed using a chi-square test. A strong answer earns marks for these points. Describe data collection procedures, such as selecting a sample, designing self-report measures, or setting up observational categories. Outline the data analysis sequence: record raw scores, identify the level of measurement, calculate descriptive statistics, draw a graph, and conduct an inferential test. Perform required calculations accurately, including percentages, fractions, ratios, measures of central tendency and dispersion, standard/decimal conversions, and significant figures. Interpret statistical findings by explaining what the calculated figure reveals about the participants or the research hypothesis, as interpretation earns significant credit. A common slip: Conflating Loftus and Palmer's experiments. Instead, Experiment 1 had five verb conditions and measured mean speed, while Experiment 2 had three conditions and used chi-square for broken glass reports. Exam tip: Always show your working for calculations; method marks can often be awarded even if a minor arithmetic slip leads to an incorrect final answer.
See it
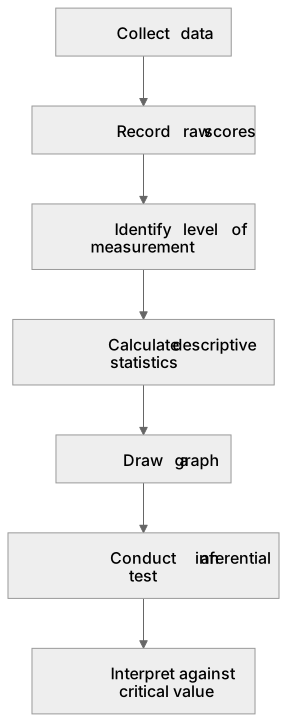
Put it in order
Put these steps in the order they happen.
- 1. Interpret against critical value
- 2. Conduct an inferential test
- 3. Identify level of measurement
- 4. Draw a graph
- 5. Collect data
- 6. Record raw scores
- 7. Calculate descriptive statistics
Key words
Say what each word means before you turn the card.
data collection
Try answering aloud or in your head before turning the card.
data handling
Try answering aloud or in your head before turning the card.
mathematical requirements
Try answering aloud or in your head before turning the card.
interpretation of results
Try answering aloud or in your head before turning the card.
See every definition
- data collection
- Procedures include sampling methods, designing questionnaires, or conducting observations.
- data handling
- Involves the collection, analysis, and presentation of data.
- mathematical requirements
- Calculations include percentages, fractions, ratios, mean, median, mode, range, standard and decimal conversions, and significant figures.
- interpretation of results
- Explaining what the calculated figure reveals about the participants or the research hypothesis.
Label the diagram
Some boxes have lost their names. Pick the right name for each number.
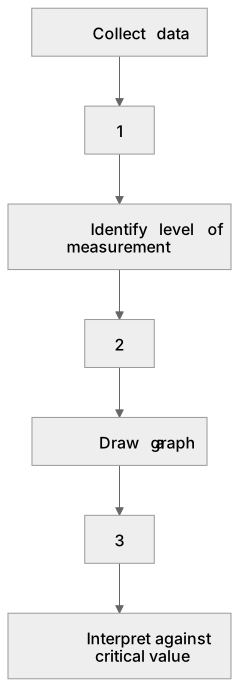
1Box 1
2Box 2
3Box 3
There is more to this lesson
The full lesson goes on to check your understanding and help you earn the marks. Create a free account to carry on, with your progress saved.
A week of Premium from your first lesson · Then the free plan continues · No card, no charge
Test your understanding of Data recording, analysis and presentation: Learners should be able to demonstrate knowledge and understanding of the process and procedures involved in the collection, analysis and presentation of data. This will necessitate the ability to perform some calculations (please see Appendix 5b for examples of mathematical requirements).
Active recall beats re-reading. Take an instant quiz now to test what you’ve learned and lock it into long-term memory.
A week of Premium from your first lesson · Then the free plan continues · No card, no charge