OCR · GCSE · Biology
Course version: J247 · Version from Sept 2018
Use a scatter diagram to identify a correlation between two variables
Full specification wording
Monitoring and maintaining health: use a scatter diagram to identify a correlation between two variables
Scatter graphs plot paired health variables to evaluate relationships between lifestyle risk factors and disease incidence.
- Point 4 of 29
- 4 key terms
Study notes
From the teaching notes for this specification point.
The idea
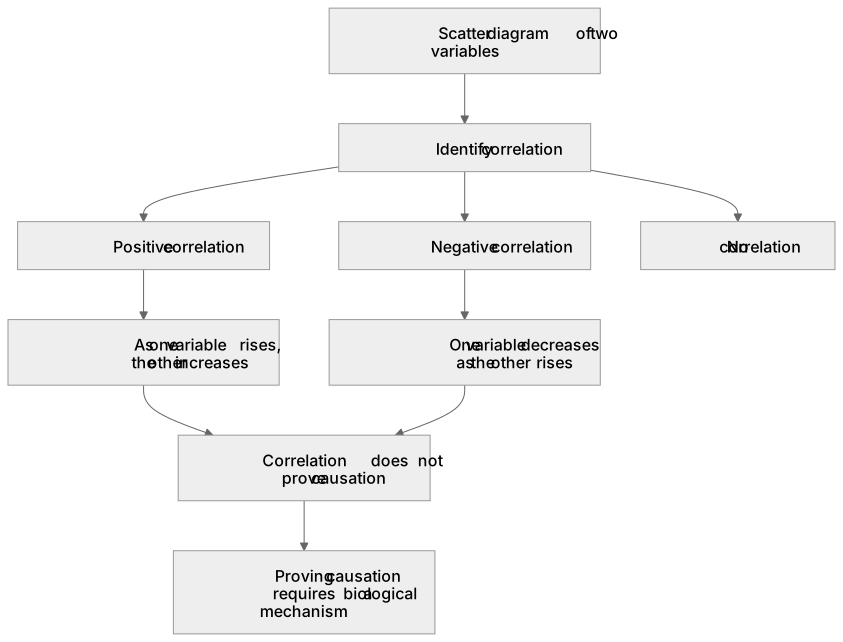
Scatter graphs plot paired health variables to evaluate relationships between lifestyle risk factors and disease incidence. A positive correlation indicates that as one variable rises, the other increases, such as daily cigarette consumption and lung cancer incidence. A negative correlation shows one variable decreasing as the other rises, such as weekly aerobic exercise and resting heart rate.
What earns the marks
- Identify positive and negative correlations from scatter graphs plotting health risk variables.
- Draw an appropriate straight line of best fit through the scatter points, balancing points on either side.
- Explain that a correlation does not prove causation, which requires identifying a proven biological mechanism.
Common mistakes and how to put them right
Assuming that a strong correlation automatically proves one factor directly causes the other.
Forcing the line of best fit on a scatter plot through the origin when the data trend does not intercept zero.
Exam tips
- State clearly: correlation does not mean causation. Proving causation requires identifying a biological mechanism, such as tar containing carcinogens that mutate DNA.
- When identifying correlations on a scatter graph, state whether it is positive, negative, or shows no correlation.
Try the lesson
The start of the Monitoring and maintaining health: use a scatter diagram to identify a correlation between two variables lesson, made from teaching notes for this specification point.
Have a go first
On a scatter diagram, the points lie close to a straight line that slopes downwards from left to right. What type of correlation does this show?
Listen
Scatter graphs plot paired health variables to evaluate relationships between lifestyle risk factors and disease incidence. A positive correlation indicates that as one variable rises, the other increases, such as daily cigarette consumption and lung cancer incidence. A negative correlation shows one variable decreasing as the other rises, such as weekly aerobic exercise and resting heart rate. A strong answer earns marks for these points. Identify positive and negative correlations from scatter graphs plotting health risk variables. Draw an appropriate straight line of best fit through the scatter points, balancing points on either side. Explain that a correlation does not prove causation, which requires identifying a proven biological mechanism. Exam tip: State clearly: correlation does not mean causation. Proving causation requires identifying a biological mechanism, such as tar containing carcinogens that mutate DNA.
See it
Key words
Say what each word means before you turn the card.
scatter diagrams
Try answering aloud or in your head before turning the card.
correlation versus causation
Try answering aloud or in your head before turning the card.
line of best fit
Try answering aloud or in your head before turning the card.
lifestyle risk factors
Try answering aloud or in your head before turning the card.
See every definition
- scatter diagrams
- Graphs that plot paired health variables to evaluate relationships between lifestyle risk factors and disease incidence.
- correlation versus causation
- Correlation establishes an association, but proving causation requires demonstrating an underlying biological mechanism.
- line of best fit
- An appropriate straight line drawn through the scatter points, balancing points on either side.
- lifestyle risk factors
- Factors plotted against disease incidence in scatter graphs to evaluate relationships between them.
Label the diagram
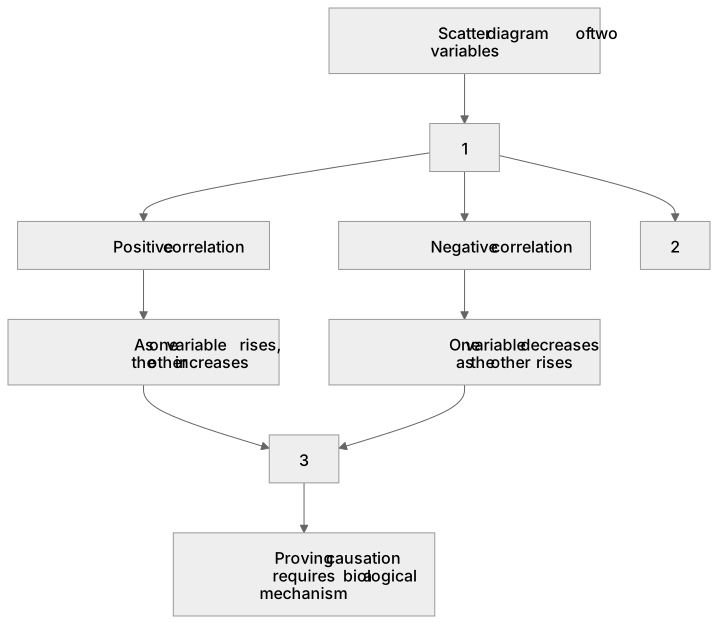
Some boxes have lost their names. Pick the right name for each number.
1Box 1
2Box 2
3Box 3
There is more to this lesson
The full lesson goes on to check your understanding and help you earn the marks. Create a free account to carry on, with your progress saved.
A week of Premium from your first lesson · Then the free plan continues · No card, no charge
Test your understanding of Monitoring and maintaining health: use a scatter diagram to identify a correlation between two variables
Active recall beats re-reading. Take an instant quiz now to test what you’ve learned and lock it into long-term memory.
A week of Premium from your first lesson · Then the free plan continues · No card, no charge