OCR · GCSE · Biology
Course version: J247 · Version from Sept 2018
Extract and interpret information from charts, graphs and tables
Full specification wording
Monitoring and maintaining the environment: extract and interpret information from charts, graphs and tables
Environmental charts, graphs and tables show how organisms and abiotic conditions vary.
- Point 4 of 9
Study notes
From the teaching notes for this specification point.
The idea
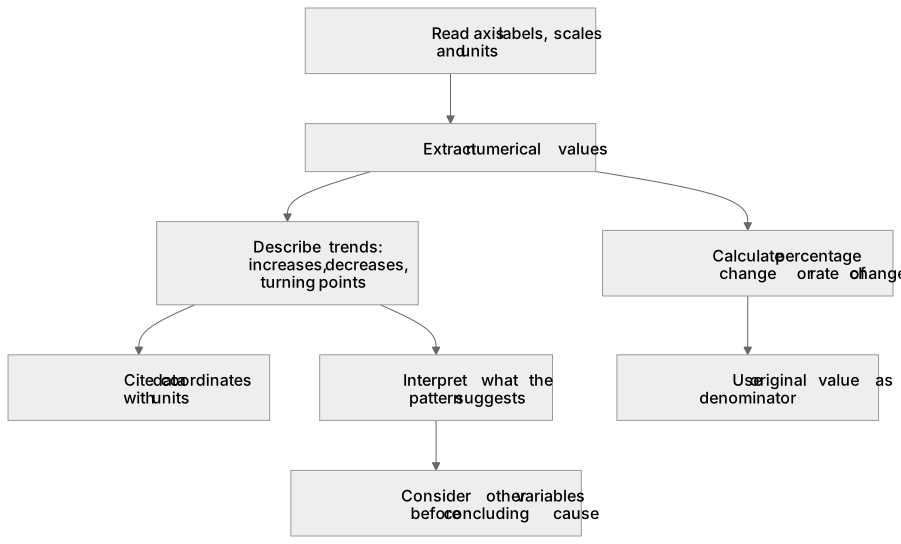
Environmental charts, graphs and tables show how organisms and abiotic conditions vary. Read the axis labels, scales and units before extracting values. Describe increases, decreases and turning points using numbers, then interpret what the pattern suggests. For example, if a table records 20 invertebrates before pollution and 12 after, the decrease is 8 and the percentage decrease is (20 − 12) ÷ 20 × 100 = 40%. Compare habitats using the same sampling effort. A correlation between nitrate concentration and species abundance may suggest an effect, but other variables must be considered before concluding that one caused the other.
What earns the marks
- Extract raw numerical values accurately from complex charts and tables, quoting appropriate metric units.
- Calculate percentage change or rates of change between two points on an ecological graph.
- Describe trends by identifying where values increase, plateau, or decrease, citing data coordinates to support statements.
- For a change from 20 to 12 organisms, calculate a decrease of 8 and a percentage decrease of 40%, using the original 20 as the denominator.
Common mistakes and how to put them right
Writing vague descriptions like 'it goes up and down' without quoting coordinates or identifying turning points.
Forgetting to calculate percentage changes when asked to compare relative rates between populations.
Exam tips
- Structure graph descriptions into distinct phases: state what happens, give the range of values over which it happens, and quote data points with units.
- When comparing two curves on the same graph, highlight differences in maximum values, peak times, and overall rates.
Try the lesson
The start of the Monitoring and maintaining the environment: extract and interpret information from charts, graphs and tables lesson, made from teaching notes for this specification point.
Have a go first
A table shows the number of mayfly nymphs in a river at four sites: site A 40, site B 25, site C 10 and site D 5. Which site has the highest number of mayfly nymphs?
Listen
Environmental charts, graphs and tables show how organisms and abiotic conditions vary. Read the axis labels, scales and units before extracting values. Describe increases, decreases and turning points using numbers, then interpret what the pattern suggests. For example, if a table records 20 invertebrates before pollution and 12 after, the decrease is 8 and the percentage decrease is (20 − 12) ÷ 20 × 100 = 40%. Compare habitats using the same sampling effort. A correlation between nitrate concentration and species abundance may suggest an effect, but other variables must be considered before concluding that one caused the other. A strong answer earns marks for these points. Extract raw numerical values accurately from complex charts and tables, quoting appropriate metric units. Calculate percentage change or rates of change between two points on an ecological graph. Describe trends by identifying where values increase, plateau, or decrease, citing data coordinates to support statements. For a change from 20 to 12 organisms, calculate a decrease of 8 and a percentage decrease of 40%, using the original 20 as the denominator. Exam tip: Structure graph descriptions into distinct phases: state what happens, give the range of values over which it happens, and quote data points with units.
See it
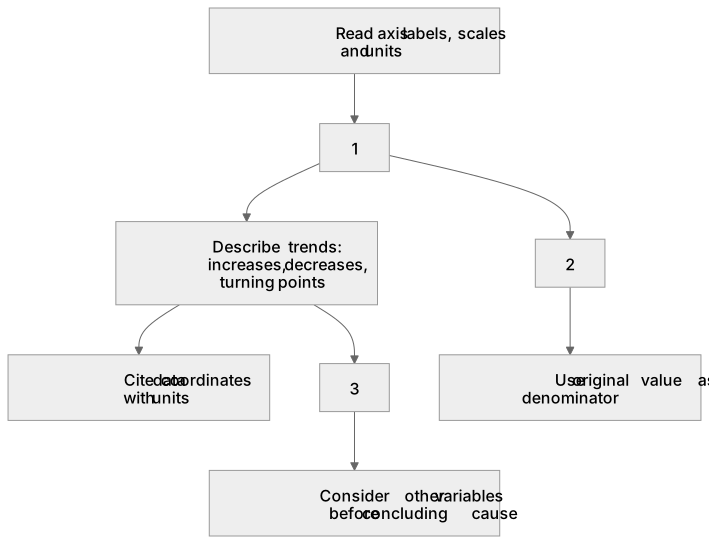
Label the diagram
Some boxes have lost their names. Pick the right name for each number.
1Box 1
2Box 2
3Box 3
There is more to this lesson
The full lesson goes on to check your understanding and help you earn the marks. Create a free account to carry on, with your progress saved.
A week of Premium from your first lesson · Then the free plan continues · No card, no charge
Test your understanding of Monitoring and maintaining the environment: extract and interpret information from charts, graphs and tables
Active recall beats re-reading. Take an instant quiz now to test what you’ve learned and lock it into long-term memory.
A week of Premium from your first lesson · Then the free plan continues · No card, no charge