OCR · GCSE · Biology
Course version: J247 · Version from Sept 2018
[Higher tier only: explain the interaction of temperature, light intensity…
Full specification wording
Photosynthesis: [Higher tier only: explain the interaction of temperature, light intensity and carbon dioxide concentration in limiting the rate of photosynthesis] (to include: using graphs depicting the effects of the limiting factors)
The principle of limiting factors states that the rate of a process is determined by the factor in shortest supply.
- Point 11 of 15
- 4 key terms
Study notes
From the teaching notes for this specification point.
The idea
The principle of limiting factors states that the rate of a process is determined by the factor in shortest supply. For photosynthesis, these are light intensity, CO₂ concentration, and temperature. On a graph of rate vs. light intensity, the initial rising slope shows light is the limiting factor; more light means a faster rate. When the graph plateaus, the rate is constant because another factor is now limiting it. For example, a curve for a plant at a low CO₂ concentration will plateau at a lower rate than a plant at a high CO₂ concentration, even with abundant light. Similarly, increasing temperature can raise the plateau, but only up to an optimum, after which enzymes may denature. Commercial growers use this knowledge in glasshouses, providing artificial light, heating, and CO₂ to maximise the rate of photosynthesis and increase crop yield.
What earns the marks
- Explaining the principle of limiting factors: the factor at the lowest or least favourable value restricts the overall rate.
- Identifying that on the rising slope of a rate–light intensity graph, light intensity is the factor limiting the rate.
- Explaining that when a light curve plateaus, another factor such as CO₂ concentration or temperature has become limiting.
- Comparing two curves on the same axes to deduce which factor (e.g. higher temperature or CO₂) caused a difference in plateau height.
- Explaining commercial greenhouse applications where heat, artificial light and CO₂ are optimised to maximise yield.
Common mistakes and how to put them right
Failing to compare two different curves on the same axes to deduce which factor caused the plateau.
Put it right: Identify what changes between the curves, such as higher CO₂ or temperature, to explain the different maximum rates.
Assuming light is always the limiting factor, ignoring that in bright conditions either temperature or CO₂ concentration is usually limiting.
Put it right: At high light intensity the plateau shows another factor is limiting the rate.
Treating the plateau as evidence that photosynthesis has stopped.
Put it right: The rate is constant because another factor is limiting, not because photosynthesis has ceased.
Exam tips
- To identify what limits the rate at the plateau on a graph, look at what has been changed between the different curves (e.g. higher CO₂ or temperature).
- Apply limiting factors to commercial agriculture: growers may burn paraffin heaters to supply both heat and carbon dioxide in glasshouses, increasing yield and profit.
Try the lesson
The start of the Photosynthesis: [Higher tier only: explain the interaction of temperature, light intensity and carbon dioxide concentration in limiting the rate of photosynthesis] (to include: using graphs depicting the effects of the limiting factors) lesson, made from teaching notes for this specification point.
Have a go first
A graph shows the rate of photosynthesis against light intensity at two different carbon dioxide concentrations. The curve for the higher carbon dioxide concentration is above the other curve and levels off at a higher rate. Explain what this shows about limiting factors.
Listen
The principle of limiting factors states that the rate of a process is determined by the factor in shortest supply. For photosynthesis, these are light intensity, CO₂ concentration, and temperature. On a graph of rate vs. light intensity, the initial rising slope shows light is the limiting factor; more light means a faster rate. When the graph plateaus, the rate is constant because another factor is now limiting it. For example, a curve for a plant at a low CO₂ concentration will plateau at a lower rate than a plant at a high CO₂ concentration, even with abundant light. Similarly, increasing temperature can raise the plateau, but only up to an optimum, after which enzymes may denature. Commercial growers use this knowledge in glasshouses, providing artificial light, heating, and CO₂ to maximise the rate of photosynthesis and increase crop yield. A strong answer earns marks for these points. Explaining the principle of limiting factors: the factor at the lowest or least favourable value restricts the overall rate. Identifying that on the rising slope of a rate–light intensity graph, light intensity is the factor limiting the rate. Explaining that when a light curve plateaus, another factor such as CO₂ concentration or temperature has become limiting. Comparing two curves on the same axes to deduce which factor (e.g. higher temperature or CO₂) caused a difference in plateau height. A common slip: Failing to compare two different curves on the same axes to deduce which factor caused the plateau. Instead, identify what changes between the curves, such as higher CO₂ or temperature, to explain the different maximum rates. Exam tip: To identify what limits the rate at the plateau on a graph, look at what has been changed between the different curves (e.g. higher CO₂ or temperature).
See it
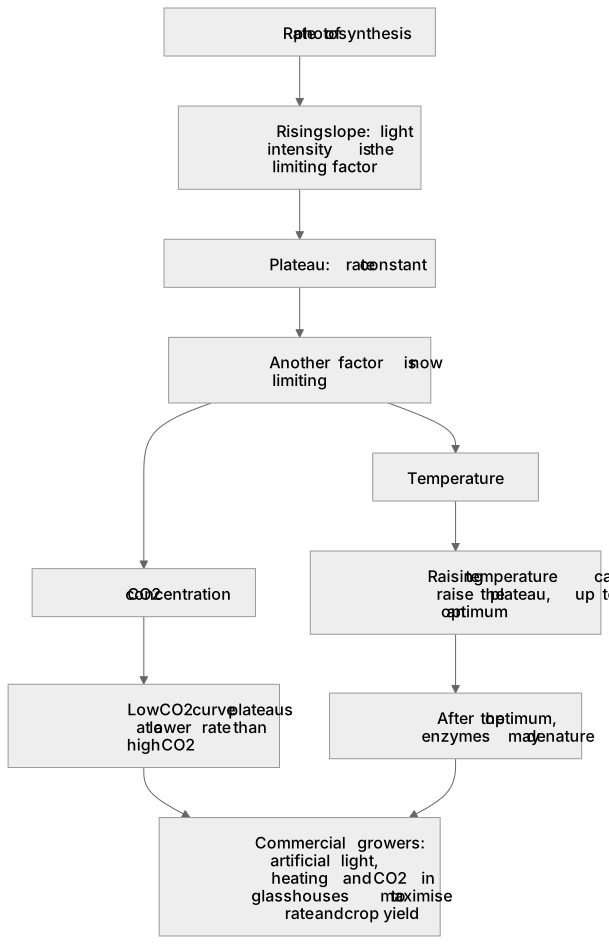
Key words
Say what each word means before you turn the card.
limiting factors
Try answering aloud or in your head before turning the card.
graph interpretation
Try answering aloud or in your head before turning the card.
rate of reaction
Try answering aloud or in your head before turning the card.
commercial applications
Try answering aloud or in your head before turning the card.
See every definition
- limiting factors
- The principle that the rate of a process is determined by the factor in shortest supply, such as light intensity, CO₂ concentration and temperature for photosynthesis.
- graph interpretation
- Reading a graph of rate against light intensity, where the initial rising slope shows light is limiting and a plateau shows another factor is now limiting.
- rate of reaction
- The rate of photosynthesis rises as light increases, stays constant at a plateau when another factor limits it, and can be raised by temperature only up to an optimum.
- commercial applications
- Commercial growers use this knowledge in glasshouses, providing artificial light, heating and CO₂ to maximise the rate of photosynthesis and increase crop yield.
Label the diagram
Some boxes have lost their names. Pick the right name for each number.
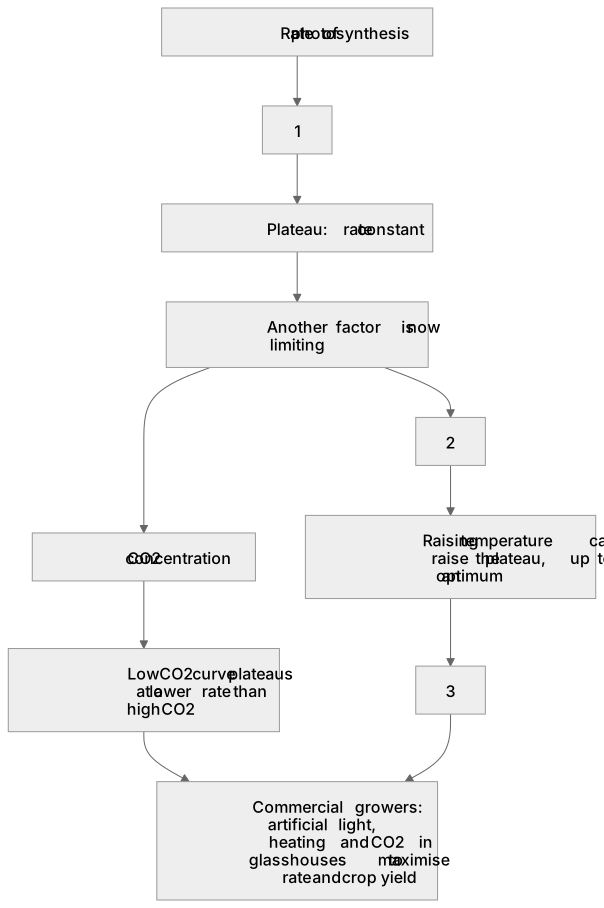
1Box 1
2Box 2
3Box 3
There is more to this lesson
The full lesson goes on to check your understanding and help you earn the marks. Create a free account to carry on, with your progress saved.
A week of Premium from your first lesson · Then the free plan continues · No card, no charge
Test your understanding of Photosynthesis: [Higher tier only: explain the interaction of temperature, light intensity and carbon dioxide concentration in limiting the rate of photosynthesis] (to include: using graphs depicting the effects of the limiting factors)
Active recall beats re-reading. Take an instant quiz now to test what you’ve learned and lock it into long-term memory.
A week of Premium from your first lesson · Then the free plan continues · No card, no charge