OCR · GCSE · Biology
Course version: J247 · Version from Sept 2018
The challenges of size: plot, draw and interpret appropriate graphs
Physiological investigations produce continuous numerical data that must be plotted and interpreted graphically.
- Point 4 of 14
- 4 key terms
Study notes
From the teaching notes for this specification point.
The idea
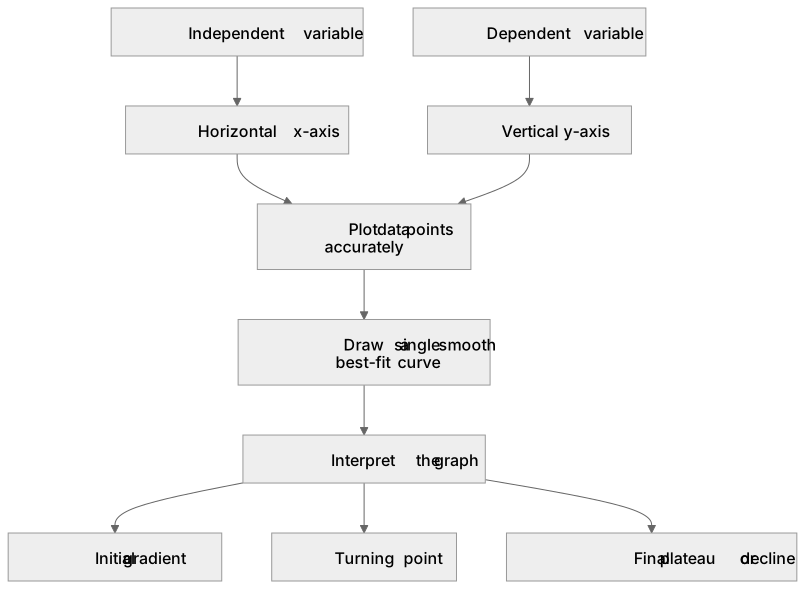
Physiological investigations produce continuous numerical data that must be plotted and interpreted graphically. In studies of transpiration or cardiovascular function, the independent variable (such as wind speed, temperature, or exercise intensity) is plotted on the horizontal x-axis, and the dependent variable (such as rate of water uptake or pulse rate) on the vertical y-axis. Interpreting slopes reveals how environmental stressors alter physiological rates until internal limits or plateaus are reached.
What earns the marks
- Plotting independent and dependent variables on correct axes with descriptive labels and units.
- Plotting data points accurately and drawing an appropriate smooth curve or line of best fit.
- Interpreting graphical features such as gradients, plateaus, and intercepts in physiological terms.
Common mistakes and how to put them right
Joining points with thick, sketchy, or disjointed straight lines instead of a single smooth best-fit curve.
Failing to recognize when a physiological plateau indicates that a transport mechanism has reached maximum capacity.
Exam tips
- Always check axes: independent variable on x-axis, dependent variable on y-axis, with complete units.
- Describe the graph in distinct stages: initial gradient, turning point, and final plateau or decline.
Try the lesson
The start of the The challenges of size: plot, draw and interpret appropriate graphs lesson, made from teaching notes for this specification point.
Have a go first
A graph shows the volume of gas produced over time. The line is straight and passes through the origin. What does a straight line through the origin show about the rate of gas production?
Listen
Physiological investigations produce continuous numerical data that must be plotted and interpreted graphically. In studies of transpiration or cardiovascular function, the independent variable (such as wind speed, temperature, or exercise intensity) is plotted on the horizontal x-axis, and the dependent variable (such as rate of water uptake or pulse rate) on the vertical y-axis. Interpreting slopes reveals how environmental stressors alter physiological rates until internal limits or plateaus are reached. A strong answer earns marks for these points. plotting independent and dependent variables on correct axes with descriptive labels and units. plotting data points accurately and drawing an appropriate smooth curve or line of best fit. interpreting graphical features such as gradients, plateaus, and intercepts in physiological terms. Exam tip: Always check axes: independent variable on x-axis, dependent variable on y-axis, with complete units.
See it
Key words
Say what each word means before you turn the card.
line of best fit
Try answering aloud or in your head before turning the card.
gradients
Try answering aloud or in your head before turning the card.
plateaus
Try answering aloud or in your head before turning the card.
transpiration and pulse graphs
Try answering aloud or in your head before turning the card.
See every definition
- line of best fit
- A single smooth curve or line drawn through plotted data points to represent the physiological trend.
- gradients
- Features of a graph that show how environmental stressors alter physiological rates until internal limits or plateaus are reached.
- plateaus
- Graphical features that indicate a transport mechanism has reached maximum capacity.
- transpiration and pulse graphs
- Graphs of studies in which the independent variable is plotted on the horizontal x-axis and the dependent variable on the vertical y-axis.
Label the diagram
Some boxes have lost their names. Pick the right name for each number.
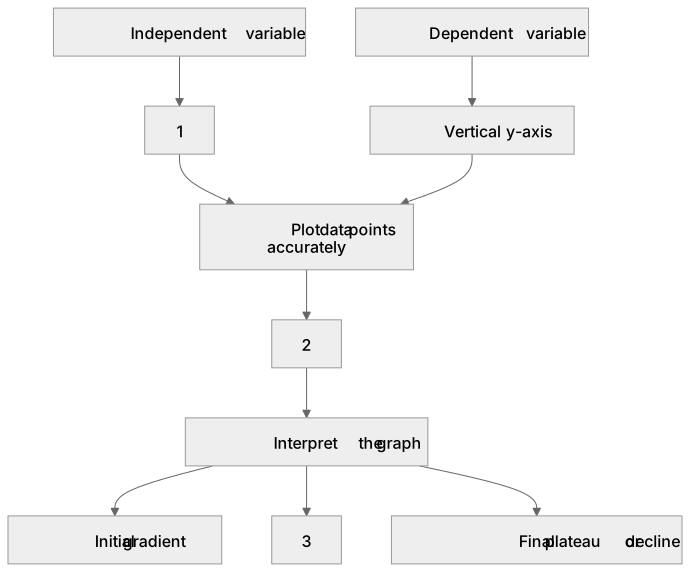
1Box 1
2Box 2
3Box 3
There is more to this lesson
The full lesson goes on to check your understanding and help you earn the marks. Create a free account to carry on, with your progress saved.
A week of Premium from your first lesson · Then the free plan continues · No card, no charge
Test your understanding of The challenges of size: plot, draw and interpret appropriate graphs
Active recall beats re-reading. Take an instant quiz now to test what you’ve learned and lock it into long-term memory.
A week of Premium from your first lesson · Then the free plan continues · No card, no charge