AQA · A-Level · Business
Course version: 7132 · Version from Sept 2023
Calculating and interpreting human resource data (to include: Students…
Full specification wording
Analysing human resource performance: Calculating and interpreting human resource data (to include: Students should be able to calculate and interpret: labour turnover, labour productivity, employee costs as percentage of turnover, labour cost per unit.)
Four ratios do the work.
- Point 1 of 2
- 4 key terms
Study notes
From the teaching notes for this specification point.
The idea
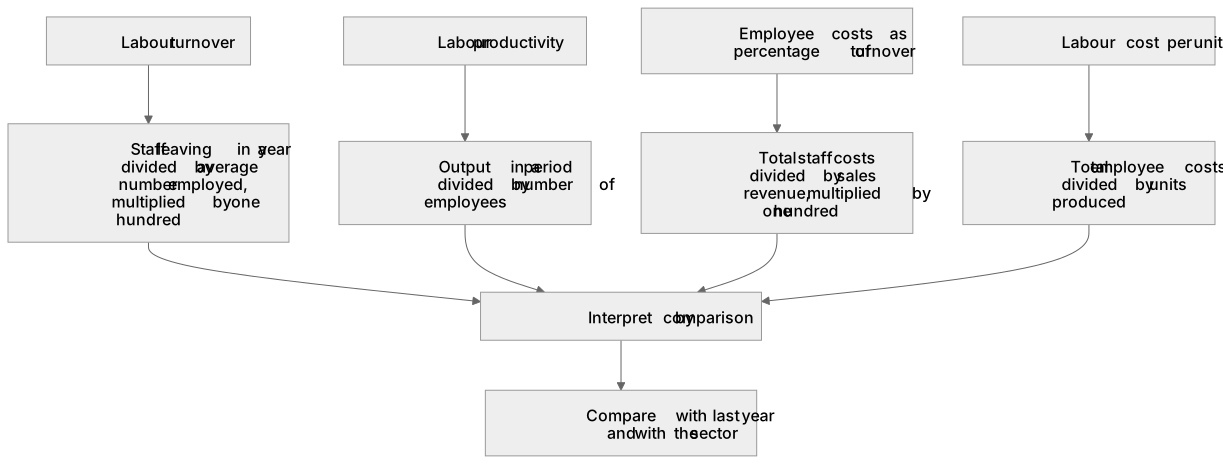
Four ratios do the work. Labour turnover is staff leaving in a year divided by the average number employed, multiplied by one hundred, read as a percentage a year. Labour productivity is output in a period divided by the number of employees, so the units are units per worker. Employee costs as a percentage of turnover divides total staff costs by sales revenue and multiplies by one hundred. Labour cost per unit divides total employee costs by units produced and comes out in pounds per unit, and that is the figure deciding whether a pay rise is affordable, because a rise of five percent in wages alongside a rise of eight percent in productivity leaves the cost per unit lower than before. Judgement comes from comparison: a leaving rate near thirty percent is routine in hospitality and alarming in aerospace, so compare with last year and with the sector, never with zero.
What earns the marks
- Using the average number employed as the denominator for labour turnover rather than the headcount at the year end, and showing the division before the percentage.
- Giving the unit with the answer, so productivity is stated as units per employee per week and labour cost per unit in pounds, because a bare number is not an interpretation.
- Comparing the figure with something real, the previous year, the sector or a rival named in the extract, and saying whether the movement helps or hurts this firm.
- Offering a cause drawn from the case, such as a new shift pattern or a rival opening locally and lifting wages, rather than asserting that morale is low.
- Carrying the number into a decision, for example showing that the cost of replacing leavers exceeds the cost of the pay rise that would have kept them.
Common mistakes and how to put them right
Reading the word turnover as sales revenue in one ratio and as staff leaving in the next, which reverses the meaning of the whole answer.
Dividing by the number of leavers instead of by the average workforce, which inverts labour turnover and produces a figure above one hundred percent without the student noticing.
Forgetting to multiply by one hundred, so a leaving rate of eighteen percent is left as a decimal and the interpretation built on it is meaningless.
Assuming higher labour productivity is always good, when it can be bought by cutting quality checks or by overworking the staff who then leave.
Exam tips
- The calculation carries few marks and the interpretation carries many, so do not spend the time the analysis needs on the arithmetic.
- Show every step, because method marks survive an arithmetic slip while a lone wrong figure earns nothing.
- When asked to analyse the data, take the two ratios that point the same way and build the argument on them instead of commenting on all four.
Try the lesson
The start of the Analysing human resource performance: Calculating and interpreting human resource data (to include: Students should be able to calculate and interpret: labour turnover, labour productivity, employee costs as percentage of turnover, labour cost per unit.) lesson, made from teaching notes for this specification point.
Have a go first
A company employed 240 staff at the beginning of the year and 260 at the end of the year. During the year, 40 employees left the company. What is the labour turnover rate?
Listen
Four ratios do the work. Labour turnover is staff leaving in a year divided by the average number employed, multiplied by one hundred, read as a percentage a year. Labour productivity is output in a period divided by the number of employees, so the units are units per worker. Employee costs as a percentage of turnover divides total staff costs by sales revenue and multiplies by one hundred. Labour cost per unit divides total employee costs by units produced and comes out in pounds per unit, and that is the figure deciding whether a pay rise is affordable, because a rise of five percent in wages alongside a rise of eight percent in productivity leaves the cost per unit lower than before. Judgement comes from comparison: a leaving rate near thirty percent is routine in hospitality and alarming in aerospace, so compare with last year and with the sector, never with zero. A strong answer earns marks for these points. Using the average number employed as the denominator for labour turnover rather than the headcount at the year end, and showing the division before the percentage. Giving the unit with the answer, so productivity is stated as units per employee per week and labour cost per unit in pounds, because a bare number is not an interpretation. Comparing the figure with something real, the previous year, the sector or a rival named in the extract, and saying whether the movement helps or hurts this firm. Offering a cause drawn from the case, such as a new shift pattern or a rival opening locally and lifting wages, rather than asserting that morale is low. Exam tip: The calculation carries few marks and the interpretation carries many, so do not spend the time the analysis needs on the arithmetic.
See it
Key words
Say what each word means before you turn the card.
labour turnover
Try answering aloud or in your head before turning the card.
labour productivity
Try answering aloud or in your head before turning the card.
employee costs as a percentage of turnover
Try answering aloud or in your head before turning the card.
labour cost per unit
Try answering aloud or in your head before turning the card.
See every definition
- labour turnover
- Staff leaving in a year divided by the average number employed, multiplied by one hundred, read as a percentage a year.
- labour productivity
- Output in a period divided by the number of employees, so the units are units per worker.
- employee costs as a percentage of turnover
- Total staff costs divided by sales revenue and multiplied by one hundred.
- labour cost per unit
- Total employee costs divided by units produced, coming out in pounds per unit.
Label the diagram
Some boxes have lost their names. Pick the right name for each number.
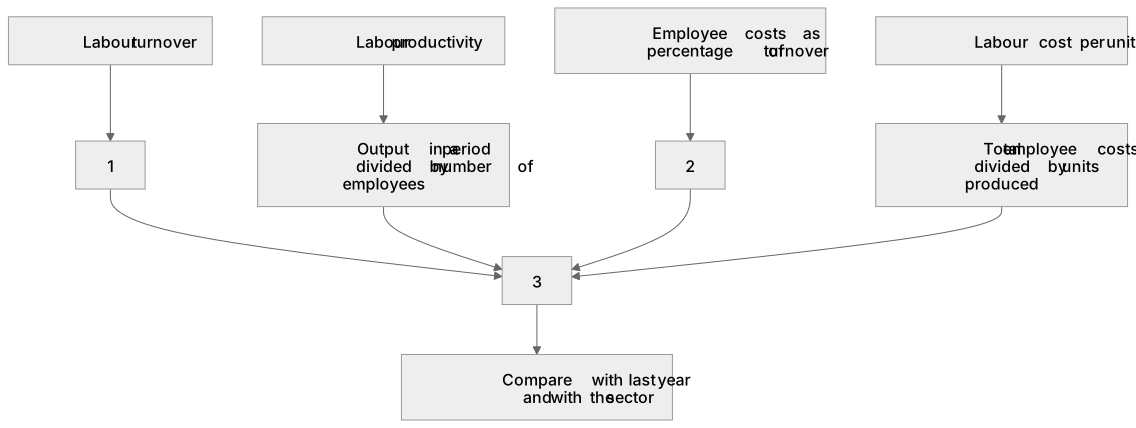
1Box 1
2Box 2
3Box 3
There is more to this lesson
The full lesson goes on to check your understanding and help you earn the marks. Create a free account to carry on, with your progress saved.
A week of Premium from your first lesson · Then the free plan continues · No card, no charge
Test your understanding of Analysing human resource performance: Calculating and interpreting human resource data (to include: Students should be able to calculate and interpret: labour turnover, labour productivity, employee costs as percentage of turnover, labour cost per unit.)
Active recall beats re-reading. Take an instant quiz now to test what you’ve learned and lock it into long-term memory.
A week of Premium from your first lesson · Then the free plan continues · No card, no charge