AQA · A-Level · Business
Course version: 7132 · Version from Sept 2023
The use of data for human resource decision making and planning
Full specification wording
Analysing human resource performance: The use of data for human resource decision making and planning
Numbers earn their keep when they change what a manager does next.
- Point 2 of 2
- 4 key terms
Study notes
From the teaching notes for this specification point.
The idea
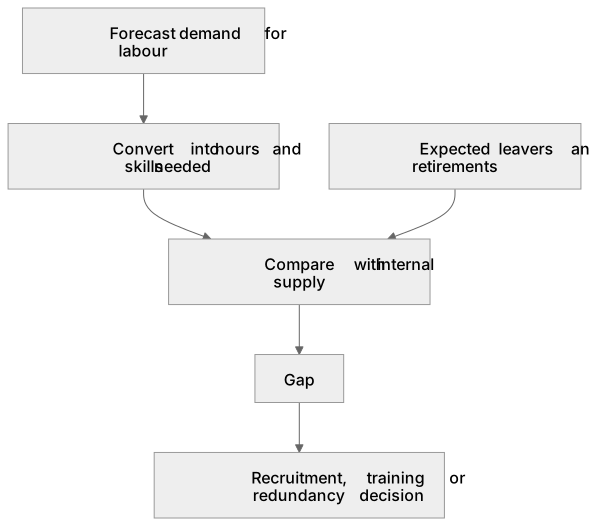
Numbers earn their keep when they change what a manager does next. A workforce plan starts from the sales or output forecast, converts it into the hours and skills the firm will need, then sets that against the supply already inside once expected leavers and retirements are taken out; the gap is the recruitment, training or redundancy decision. Absence records, exit interviews, appraisal ratings and engagement scores do the same job at a smaller scale, pointing at the department where something has gone wrong. The limits matter as much as the figures. Averages hide the problem, since an overall leaving rate of fifteen percent can conceal a rate three times that on one shift, and every measure describes what has already happened rather than why. The evidence narrows the choice; the manager who has spoken to the shift still has to make it.
What earns the marks
- Working from forecast demand for labour to the internal supply already expected, and naming the gap as the thing the plan has to close.
- Choosing the measure that fits the decision, for example exit interview evidence rather than an engagement score when the question is why staff are leaving one site.
- Breaking the average down, so the answer looks at the department or shift behind the whole firm figure.
- Treating evidence as a trigger for action and saying what the business should now do with the finding.
- Weighing reliability, since a forecast built on volatile demand makes every workforce number that follows it provisional.
Common mistakes and how to put them right
Describing what the table shows and stopping, which is commentary without the decision the question asked for.
Treating a correlation as a cause, such as blaming a new manager for a rise in absence when a flu outbreak fell in the same quarter.
Assuming more measurement is better, when collecting and processing it costs management time a small firm does not have.
Ignoring that staff behave differently once they know what is measured, so an absence target can turn into people coming to work ill.
Exam tips
- This is usually examined through a table or chart in the case, so quote the figure you are using and where it came from before commenting on it.
- An assess question rewards a line on the quality of the evidence itself, for instance that it covers one year and one site.
- A recommend question wants a decision plus the option you rejected and why, not a list of possibilities.
Try the lesson
The start of the Analysing human resource performance: The use of data for human resource decision making and planning lesson, made from teaching notes for this specification point.
Have a go first
A business employs 250 staff. In one year, 20 employees leave the business. What is the labour turnover rate for that year?
Listen
Numbers earn their keep when they change what a manager does next. A workforce plan starts from the sales or output forecast, converts it into the hours and skills the firm will need, then sets that against the supply already inside once expected leavers and retirements are taken out; the gap is the recruitment, training or redundancy decision. Absence records, exit interviews, appraisal ratings and engagement scores do the same job at a smaller scale, pointing at the department where something has gone wrong. The limits matter as much as the figures. Averages hide the problem, since an overall leaving rate of fifteen percent can conceal a rate three times that on one shift, and every measure describes what has already happened rather than why. The evidence narrows the choice; the manager who has spoken to the shift still has to make it. A strong answer earns marks for these points. Working from forecast demand for labour to the internal supply already expected, and naming the gap as the thing the plan has to close. Choosing the measure that fits the decision, for example exit interview evidence rather than an engagement score when the question is why staff are leaving one site. Breaking the average down, so the answer looks at the department or shift behind the whole firm figure. Treating evidence as a trigger for action and saying what the business should now do with the finding. Exam tip: This is usually examined through a table or chart in the case, so quote the figure you are using and where it came from before commenting on it.
See it
Key words
Say what each word means before you turn the card.
workforce planning
Try answering aloud or in your head before turning the card.
internal labour supply
Try answering aloud or in your head before turning the card.
exit interviews
Try answering aloud or in your head before turning the card.
limits of averages
Try answering aloud or in your head before turning the card.
See every definition
- workforce planning
- Starting from the sales or output forecast, converting it into the hours and skills the firm will need, then setting that against the supply already inside once expected leavers and retirements are taken out.
- internal labour supply
- The supply already inside the firm once expected leavers and retirements are taken out, which the forecast demand for labour is set against.
- exit interviews
- Evidence that does the same job at a smaller scale as absence records, appraisal ratings and engagement scores, pointing at the department where something has gone wrong.
- limits of averages
- Averages hide the problem, since an overall leaving rate of fifteen percent can conceal a rate three times that on one shift.
Label the diagram
Some boxes have lost their names. Pick the right name for each number.
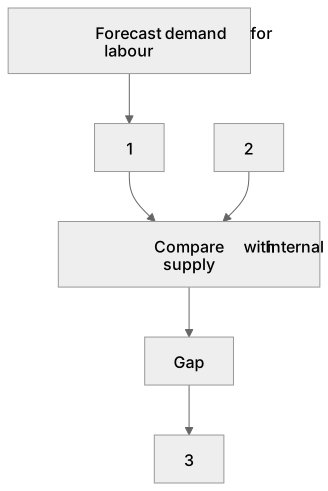
1Box 1
2Box 2
3Box 3
There is more to this lesson
The full lesson goes on to check your understanding and help you earn the marks. Create a free account to carry on, with your progress saved.
A week of Premium from your first lesson · Then the free plan continues · No card, no charge
Test your understanding of Analysing human resource performance: The use of data for human resource decision making and planning
Active recall beats re-reading. Take an instant quiz now to test what you’ve learned and lock it into long-term memory.
A week of Premium from your first lesson · Then the free plan continues · No card, no charge