AQA · A-Level · Business
Course version: 7132 · Version from Sept 2023
Financial ratio analysis: How to assess the financial performance of a…
Full specification wording
Analysing the existing internal position of a business to assess strengths and weaknesses: financial ratio analysis: How to assess the financial performance of a business using balance sheets, income statements and financial ratios (to include: Financial ratio analysis to include: profitability (return on capital employed), liquidity (current ratio), gearing, efficiency ratios: payables days, receivables days, inventory turnover.)
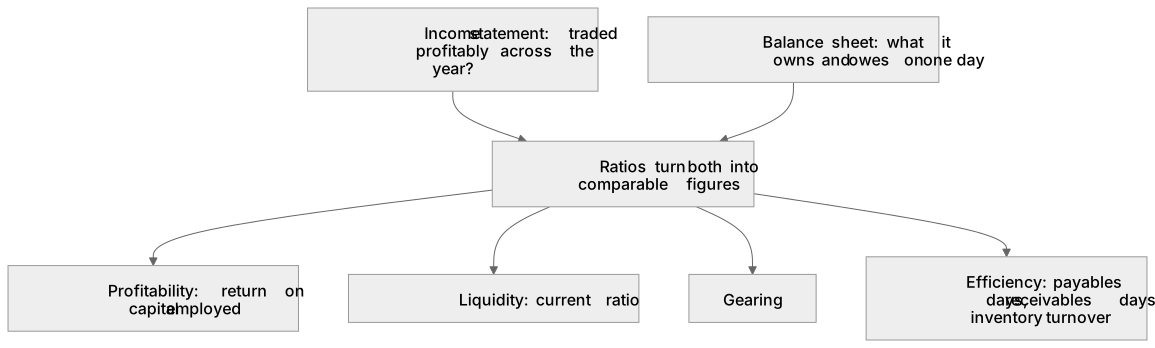
Three documents answer three different questions: the income statement asks whether the firm traded profitably across the year, the balance sheet asks what it owns and owes on one day, and ratios…
- Point 1 of 2
- 2 key terms
Study notes
From the teaching notes for this specification point.
The idea
Three documents answer three different questions: the income statement asks whether the firm traded profitably across the year, the balance sheet asks what it owns and owes on one day, and ratios turn both into figures that can be compared. Return on capital employed is operating profit divided by capital employed, multiplied by one hundred, reported as a percentage, and is the headline test of whether invested money works harder than it would in a bank. The current ratio is current assets divided by current liabilities, read as a ratio to one. Gearing is non current liabilities divided by capital employed as a percentage. The efficiency measures are in days or in times per year: payables days, receivables days, and inventory turnover, which is cost of sales divided by average inventory.
What earns the marks
- Calculating from the right figures, so capital employed is total equity plus non current liabilities and return on capital employed uses operating profit rather than profit after tax.
- Attaching a unit and a direction to every answer, a percentage for return on capital employed and gearing, a ratio to one for liquidity, days for payables and receivables, times per year for inventory turnover.
- Reading the statements for what the ratios miss, such as a large loan repayable within the year sitting in current liabilities, or revenue growth hiding a falling operating margin.
- Linking two measures, for example rising receivables days explaining why a profitable firm has run out of cash.
Common mistakes and how to put them right
Using revenue instead of operating profit, or total assets instead of capital employed, in return on capital employed, which changes both the answer and the verdict.
Reversing receivables and payables days, so slow paying customers are praised as good cash management.
Calculating correctly and then not interpreting, leaving the number on the page with no comment on whether it is good for this business.
Forgetting to multiply by one hundred, so a return of a fifth is reported as nought point two per cent.
Exam tips
- Calculations here are usually worth three or four marks and the method carries most of them, so write the formula, substitute the figures and label the unit even if the arithmetic slips.
- The examiner rarely wants one measure alone: the question hands you two years or two firms, so work out both and comment on the movement.
- Carry the number into a written judgement later in the paper, because a figure quoted inside an evaluation earns more than a figure standing on its own.
Try the lesson
The start of the Analysing the existing internal position of a business to assess strengths and weaknesses: financial ratio analysis: How to assess the financial performance of a business using balance sheets, income statements and financial ratios (to include: Financial ratio analysis to include: profitability (return on capital employed), liquidity (current ratio), gearing, efficiency ratios: payables days, receivables days, inventory turnover.) lesson, made from teaching notes for this specification point.
Have a go first
A manufacturing company reports an operating profit of £90,000 for the year. Its capital employed is £750,000. What is the company's return on capital employed (ROCE)?
Listen
Three documents answer three different questions: the income statement asks whether the firm traded profitably across the year, the balance sheet asks what it owns and owes on one day, and ratios turn both into figures that can be compared. Return on capital employed is operating profit divided by capital employed, multiplied by one hundred, reported as a percentage, and is the headline test of whether invested money works harder than it would in a bank. The current ratio is current assets divided by current liabilities, read as a ratio to one. Gearing is non current liabilities divided by capital employed as a percentage. The efficiency measures are in days or in times per year: payables days, receivables days, and inventory turnover, which is cost of sales divided by average inventory. A strong answer earns marks for these points. Calculating from the right figures, so capital employed is total equity plus non current liabilities and return on capital employed uses operating profit rather than profit after tax. Attaching a unit and a direction to every answer, a percentage for return on capital employed and gearing, a ratio to one for liquidity, days for payables and receivables, times per year for inventory turnover. Saying what a good and a bad value looks like for this firm, so gearing above half is risky when interest rates are rising but normal for a utility with steady cash flow, and a current ratio far above two suggests cash sitting idle. Reading the statements for what the ratios miss, such as a large loan repayable within the year sitting in current liabilities, or revenue growth hiding a falling operating margin. Exam tip: Calculations here are usually worth three or four marks and the method carries most of them, so write the formula, substitute the figures and label the unit even if the arithmetic slips.
See it
Key words
Say what each word means before you turn the card.
gearing
Try answering aloud or in your head before turning the card.
efficiency ratios
Try answering aloud or in your head before turning the card.
See every definition
- gearing
- Non current liabilities divided by capital employed as a percentage.
- efficiency ratios
- The efficiency measures are in days or in times per year: payables days, receivables days, and inventory turnover, which is cost of sales divided by average inventory.
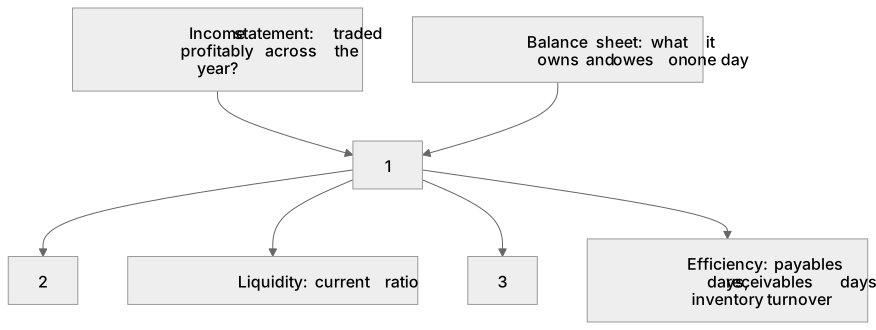
Label the diagram
Some boxes have lost their names. Pick the right name for each number.
1Box 1
2Box 2
3Box 3
There is more to this lesson
The full lesson goes on to check your understanding and help you earn the marks. Create a free account to carry on, with your progress saved.
A week of Premium from your first lesson · Then the free plan continues · No card, no charge
Test your understanding of Analysing the existing internal position of a business to assess strengths and weaknesses: financial ratio analysis: How to assess the financial performance of a business using balance sheets, income statements and financial ratios (to include: Financial ratio analysis to include: profitability (return on capital employed), liquidity (current ratio), gearing, efficiency ratios: payables days, receivables days, inventory turnover.)
Active recall beats re-reading. Take an instant quiz now to test what you’ve learned and lock it into long-term memory.
A week of Premium from your first lesson · Then the free plan continues · No card, no charge