AQA · A-Level · Business
Course version: 7132 · Version from Sept 2023
Overall performance: How to analyse data other than financial statements…
Full specification wording
Analysing the existing internal position of a business to assess strengths and weaknesses: overall performance: How to analyse data other than financial statements to assess the strengths and weaknesses of a business (to include: Data other than financial statements should include operations, human resource and marketing data. Data may be analysed over time or in comparison with other businesses.)
Financial statements record what happened to the money; operations, human resource and marketing figures show why it happened, which is why examiners put them in an appendix.
- Point 1 of 4
- 4 key terms
Study notes
From the teaching notes for this specification point.
The idea
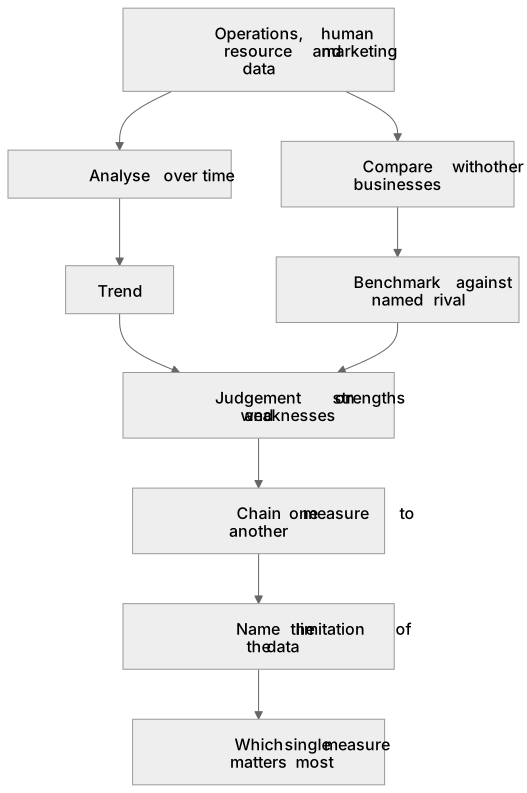
Financial statements record what happened to the money; operations, human resource and marketing figures show why it happened, which is why examiners put them in an appendix. Capacity utilisation is actual output divided by maximum possible output times one hundred, labour productivity is output per worker per period, labour turnover is staff leaving divided by average staff employed times one hundred, and market share is firm sales divided by total market sales times one hundred. None of these means anything on its own. A single year is a fact, a three year trend or a benchmark against a named rival is a judgement, and judgement is what is rewarded. The trade-off to notice is that these measures pull against each other: running plant at ninety five per cent of capacity looks efficient and leaves no room for a rush order.
What earns the marks
- Comparing like with like and saying which comparison is being made, either the same measure over several years or the same measure against a competitor in the same market.
- Chaining one measure to another, so rising labour turnover explains falling output per worker, which explains rising unit costs and slipping delivery times.
- Naming the limitation of the data before judging, such as the absence of an industry benchmark or the fact that every figure is historic and says nothing about next year.
Common mistakes and how to put them right
Working through every row of the appendix rather than selecting the two or three figures that actually bear on the decision the question asks about.
Calling one year's number a strength or a weakness with no trend and no benchmark, which leaves the claim unsupported.
Mixing up labour productivity and labour turnover, so a staffing problem is diagnosed as an output problem and the recommendation misses.
Exam tips
- Non-financial data arrives as a small table, and the question normally asks you to analyse strengths and weaknesses, so work down the table asking what each row causes rather than what it is.
- In an assess or evaluate question, finish on which single measure matters most to this business given its objectives, instead of summarising all of them again.
Try the lesson
The start of the Analysing the existing internal position of a business to assess strengths and weaknesses: overall performance: How to analyse data other than financial statements to assess the strengths and weaknesses of a business (to include: Data other than financial statements should include operations, human resource and marketing data. Data may be analysed over time or in comparison with other businesses.) lesson, made from teaching notes for this specification point.
Have a go first
Which type of non-financial data measures the proportion of staff who leave a business over a year?
Listen
Financial statements record what happened to the money; operations, human resource and marketing figures show why it happened, which is why examiners put them in an appendix. Capacity utilisation is actual output divided by maximum possible output times one hundred, labour productivity is output per worker per period, labour turnover is staff leaving divided by average staff employed times one hundred, and market share is firm sales divided by total market sales times one hundred. None of these means anything on its own. A single year is a fact, a three year trend or a benchmark against a named rival is a judgement, and judgement is what is rewarded. The trade-off to notice is that these measures pull against each other: running plant at ninety five per cent of capacity looks efficient and leaves no room for a rush order. A strong answer earns marks for these points. Quoting the actual figure from the appendix and saying what it means for this firm, for instance capacity utilisation of sixty per cent meaning two fifths of the plant sits idle while fixed costs still have to be covered. Comparing like with like and saying which comparison is being made, either the same measure over several years or the same measure against a competitor in the same market. Chaining one measure to another, so rising labour turnover explains falling output per worker, which explains rising unit costs and slipping delivery times. Naming the limitation of the data before judging, such as the absence of an industry benchmark or the fact that every figure is historic and says nothing about next year. Exam tip: Non-financial data arrives as a small table, and the question normally asks you to analyse strengths and weaknesses, so work down the table asking what each row causes rather than what it is.
See it
Key words
Say what each word means before you turn the card.
non-financial performance data
Try answering aloud or in your head before turning the card.
trend analysis and benchmarking
Try answering aloud or in your head before turning the card.
capacity utilisation and productivity
Try answering aloud or in your head before turning the card.
strengths and weaknesses
Try answering aloud or in your head before turning the card.
See every definition
- non-financial performance data
- Operations, human resource and marketing figures that show why what happened to the money happened, rather than recording the money itself.
- trend analysis and benchmarking
- Analysing data over time or in comparison with other businesses, so that a three year trend or a benchmark against a named rival supports a judgement.
- capacity utilisation and productivity
- Capacity utilisation is actual output divided by maximum possible output times one hundred; labour productivity is output per worker per period.
- strengths and weaknesses
- A judgement about a business that needs a trend or a benchmark, because a single year is a fact and none of these measures means anything on its own.
Label the diagram
Some boxes have lost their names. Pick the right name for each number.
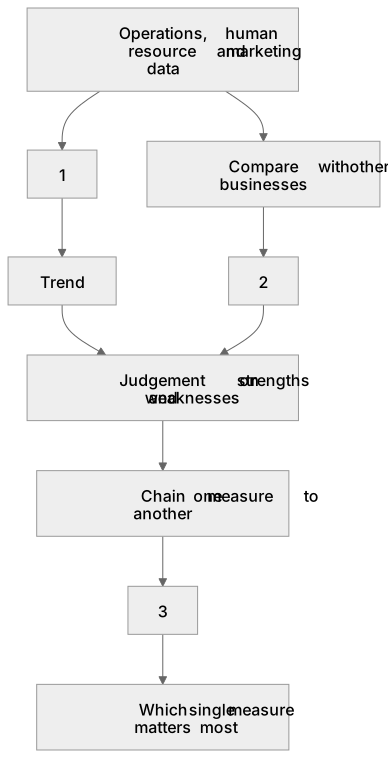
1Box 1
2Box 2
3Box 3
There is more to this lesson
The full lesson goes on to check your understanding and help you earn the marks. Create a free account to carry on, with your progress saved.
A week of Premium from your first lesson · Then the free plan continues · No card, no charge
Test your understanding of Analysing the existing internal position of a business to assess strengths and weaknesses: overall performance: How to analyse data other than financial statements to assess the strengths and weaknesses of a business (to include: Data other than financial statements should include operations, human resource and marketing data. Data may be analysed over time or in comparison with other businesses.)
Active recall beats re-reading. Take an instant quiz now to test what you’ve learned and lock it into long-term memory.
A week of Premium from your first lesson · Then the free plan continues · No card, no charge