AQA · A-Level · Business
Course version: 7132 · Version from Sept 2023
Quantitative skills in business: construct and interpret a range of…
Full specification wording
Annex: quantitative skills in business: construct and interpret a range of standard graphical forms
A chart is an argument about data rather than decoration, so the shape has to fit the question.
- Point 3 of 9
- 4 key terms
Study notes
From the teaching notes for this specification point.
The idea
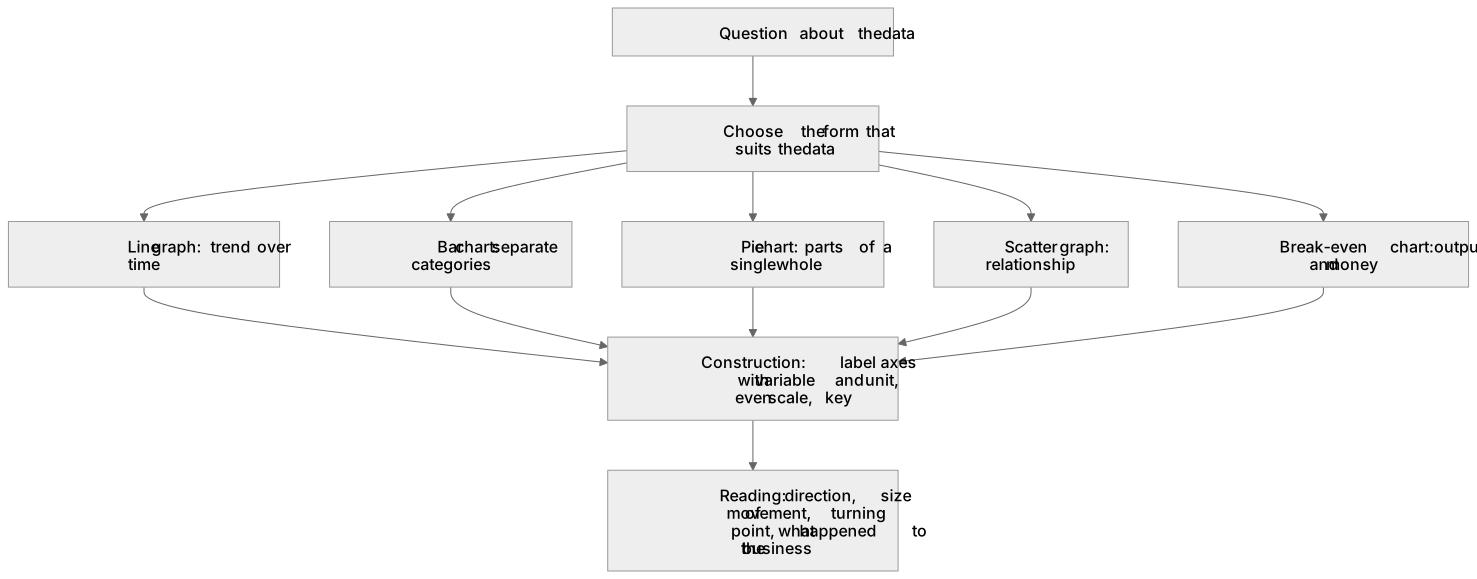
A chart is an argument about data rather than decoration, so the shape has to fit the question. A line graph carries a trend over time such as monthly sales; a bar chart compares separate categories such as revenue by region; a pie chart belongs only to parts of a single whole such as market share; a scatter graph shows a relationship such as advertising spend against sales. The drawing marks live in dull details, axes labelled with the variable and its unit, an even scale, a key. The reading marks live somewhere else entirely: give the direction, quantify the size of the movement, find the turning point and ask what happened to this business on that date. The break-even chart is the one most often demanded, output along the horizontal axis and money up the vertical.
What earns the marks
- Picking the form that suits the data and saying why, a pie chart for shares of one market and a line graph for a series running through time.
- Labelling both axes with the variable and its unit and plotting to an even scale, since a break-even chart with an unlabelled vertical axis cannot show the break-even output at all.
- Lifting a specific value off the chart and using it, the break-even output, the margin of safety, or the month in which the cash balance turns negative.
- Describing a trend by direction, rate and turning point rather than walking the marker through every plotted point in turn.
Common mistakes and how to put them right
Drawing a break-even chart with the total cost line starting at the origin, which erases fixed costs and pushes break-even to entirely the wrong output.
Describing the shape of the line without connecting it to the business, so the answer says sales rose steeply and never asks whether the new store or the advertising campaign explains it.
Accepting a truncated vertical axis in the case study's own chart, when a scale that does not begin at zero makes a modest rise look dramatic and is itself an evaluation point.
Exam tips
- Construction usually carries few marks and interpretation many, so do not spend fifteen minutes with a ruler and one sentence on the meaning.
- When the paper prints a chart, quote a number read off its axis in your answer; markers reward the figure, not the phrase the graph shows.
Try the lesson
The start of the Annex: quantitative skills in business: construct and interpret a range of standard graphical forms lesson, made from teaching notes for this specification point.
Have a go first
On a bar chart showing a firm's sales revenue, what does the height of each bar represent?
Listen
A chart is an argument about data rather than decoration, so the shape has to fit the question. A line graph carries a trend over time such as monthly sales; a bar chart compares separate categories such as revenue by region; a pie chart belongs only to parts of a single whole such as market share; a scatter graph shows a relationship such as advertising spend against sales. The drawing marks live in dull details, axes labelled with the variable and its unit, an even scale, a key. The reading marks live somewhere else entirely: give the direction, quantify the size of the movement, find the turning point and ask what happened to this business on that date. The break-even chart is the one most often demanded, output along the horizontal axis and money up the vertical. A strong answer earns marks for these points. Picking the form that suits the data and saying why, a pie chart for shares of one market and a line graph for a series running through time. Labelling both axes with the variable and its unit and plotting to an even scale, since a break-even chart with an unlabelled vertical axis cannot show the break-even output at all. Lifting a specific value off the chart and using it, the break-even output, the margin of safety, or the month in which the cash balance turns negative. Describing a trend by direction, rate and turning point rather than walking the marker through every plotted point in turn. Exam tip: Construction usually carries few marks and interpretation many, so do not spend fifteen minutes with a ruler and one sentence on the meaning.
See it
Key words
Say what each word means before you turn the card.
chart selection
Try answering aloud or in your head before turning the card.
axes and scales
Try answering aloud or in your head before turning the card.
break-even charts
Try answering aloud or in your head before turning the card.
trend description
Try answering aloud or in your head before turning the card.
See every definition
- chart selection
- Picking the form that suits the data and saying why, such as a pie chart for shares of one market and a line graph for a series running through time.
- axes and scales
- Labelling both axes with the variable and its unit and plotting to an even scale, since an unlabelled vertical axis cannot show break-even output.
- break-even charts
- A chart with output along the horizontal axis and money up the vertical, showing break-even output and margin of safety.
- trend description
- Describing a trend by direction, rate and turning point rather than walking the marker through every plotted point in turn.
Label the diagram
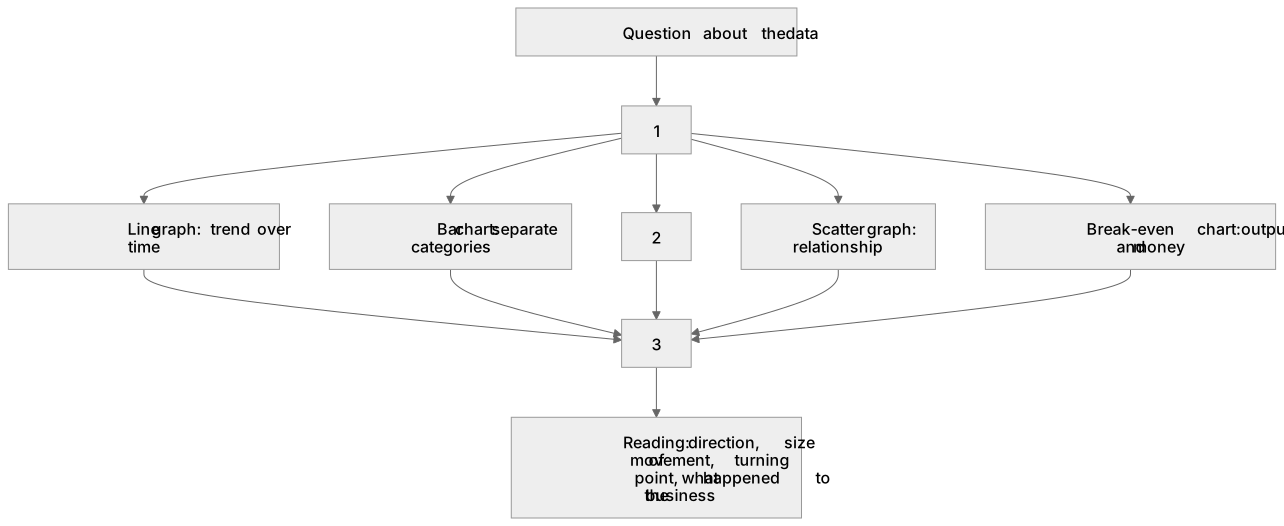
Some boxes have lost their names. Pick the right name for each number.
1Box 1
2Box 2
3Box 3
There is more to this lesson
The full lesson goes on to check your understanding and help you earn the marks. Create a free account to carry on, with your progress saved.
A week of Premium from your first lesson · Then the free plan continues · No card, no charge
Test your understanding of Annex: quantitative skills in business: construct and interpret a range of standard graphical forms
Active recall beats re-reading. Take an instant quiz now to test what you’ve learned and lock it into long-term memory.
A week of Premium from your first lesson · Then the free plan continues · No card, no charge