AQA · A-Level · Business
Course version: 7132 · Version from Sept 2023
The interpretation of marketing data (to include: Interpretation of…
Full specification wording
Understanding markets and customers: The interpretation of marketing data (to include: Interpretation of marketing data should include: positive and negative correlation and an understanding of the strength of the relationship, understanding the concept of confidence intervals, understanding extrapolation.)
This is where a number becomes a decision.
- Point 3 of 6
- 4 key terms
Study notes
From the teaching notes for this specification point.
The idea
This is where a number becomes a decision. Plot advertising spend against sales and the cloud of points may slope upward; the closer they sit to the line of best fit the stronger the link, so a strong positive pattern supports a bigger budget while a weak one warns that something else is moving sales. Association is never proof of cause, and saying so is where the evaluation marks live. A confidence interval puts a range around a sample figure, so a survey result of forty per cent quoted with a three point interval at the usual ninety five per cent level says the real figure very probably lies between thirty seven and forty three per cent. Continuing a trend past the last known point is only as safe as the assumption that nothing changes, which is why travel forecasts drawn from 2019 collapsed in 2020.
What earns the marks
- Naming both the direction and the strength of the relationship, then saying what that strength means for how much weight the decision can bear.
- Stating that the data shows association rather than cause, and naming a plausible third factor from the case such as a rival's price cut or a seasonal peak.
- Reading an interval as a range with a stated level of confidence, and using its lower end when judging whether the project still works.
- Projecting a trend forward and then qualifying it, saying which assumption would have to hold for the forecast to be reliable.
Common mistakes and how to put them right
Writing that the figures prove advertising causes sales, when the case has usually just supplied an obvious alternative explanation.
Treating an interval as a guarantee, so the sample figure is reported as the exact market figure.
Projecting a trend a long way past the data and treating the result as a fact, ignoring that the further out the forecast reaches the wider its error.
Exam tips
- Data response papers print a scatter diagram or a table and ask you to analyse what it shows, so describe the pattern in the numbers before you explain it.
- When a question asks whether a firm should rely on a forecast, the top marks come from weighing the quality of the underlying data rather than from redescribing the graph.
Try the lesson
The start of the Understanding markets and customers: The interpretation of marketing data (to include: Interpretation of marketing data should include: positive and negative correlation and an understanding of the strength of the relationship, understanding the concept of confidence intervals, understanding extrapolation.) lesson, made from teaching notes for this specification point.
Have a go first
What does a positive correlation between advertising spend and sales revenue indicate?
Listen
This is where a number becomes a decision. Plot advertising spend against sales and the cloud of points may slope upward; the closer they sit to the line of best fit the stronger the link, so a strong positive pattern supports a bigger budget while a weak one warns that something else is moving sales. Association is never proof of cause, and saying so is where the evaluation marks live. A confidence interval puts a range around a sample figure, so a survey result of forty per cent quoted with a three point interval at the usual ninety five per cent level says the real figure very probably lies between thirty seven and forty three per cent. Continuing a trend past the last known point is only as safe as the assumption that nothing changes, which is why travel forecasts drawn from 2019 collapsed in 2020. A strong answer earns marks for these points. Naming both the direction and the strength of the relationship, then saying what that strength means for how much weight the decision can bear. Stating that the data shows association rather than cause, and naming a plausible third factor from the case such as a rival's price cut or a seasonal peak. Reading an interval as a range with a stated level of confidence, and using its lower end when judging whether the project still works. Projecting a trend forward and then qualifying it, saying which assumption would have to hold for the forecast to be reliable. Exam tip: Data response papers print a scatter diagram or a table and ask you to analyse what it shows, so describe the pattern in the numbers before you explain it.
See it
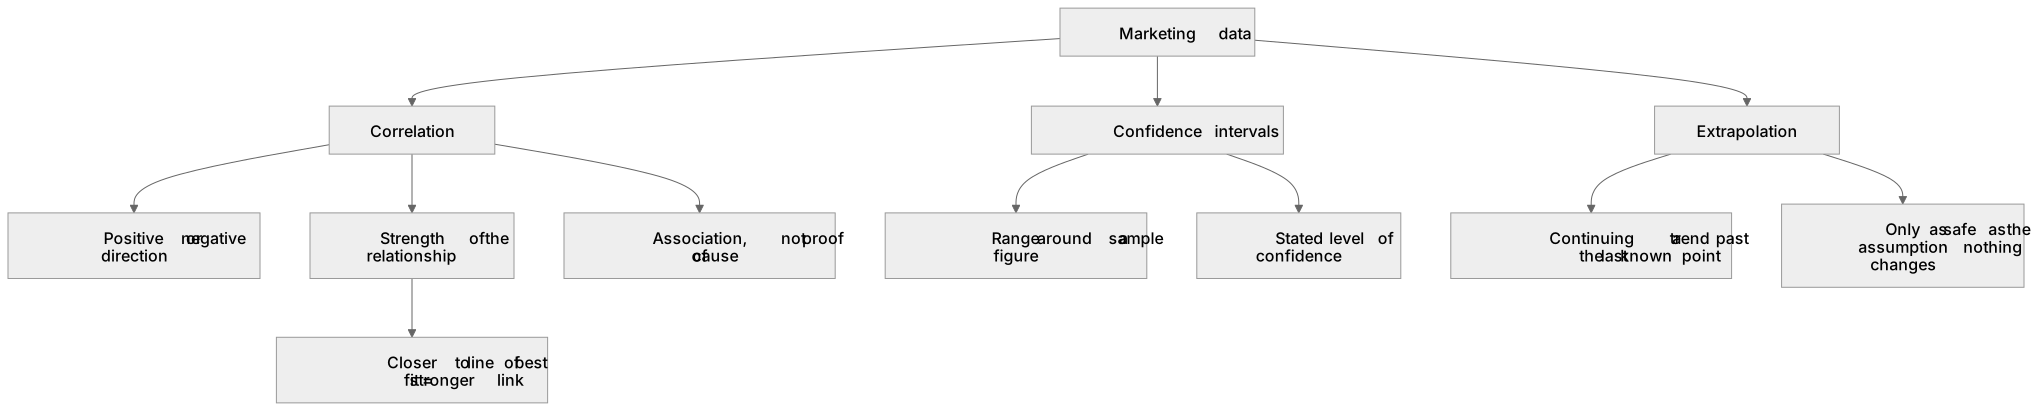
Key words
Say what each word means before you turn the card.
correlation and causation
Try answering aloud or in your head before turning the card.
strength of relationship
Try answering aloud or in your head before turning the card.
confidence intervals
Try answering aloud or in your head before turning the card.
forecasting risk
Try answering aloud or in your head before turning the card.
See every definition
- correlation and causation
- Association is never proof of cause, and saying so is where the evaluation marks live.
- strength of relationship
- The closer the points sit to the line of best fit the stronger the link, so a strong positive pattern supports a bigger budget while a weak one warns that something else is moving sales.
- confidence intervals
- A range is put around a sample figure, so a survey result quoted with an interval at the usual level says the real figure very probably lies within that range.
- forecasting risk
- Continuing a trend past the last known point is only as safe as the assumption that nothing changes.
Label the diagram
Some boxes have lost their names. Pick the right name for each number.
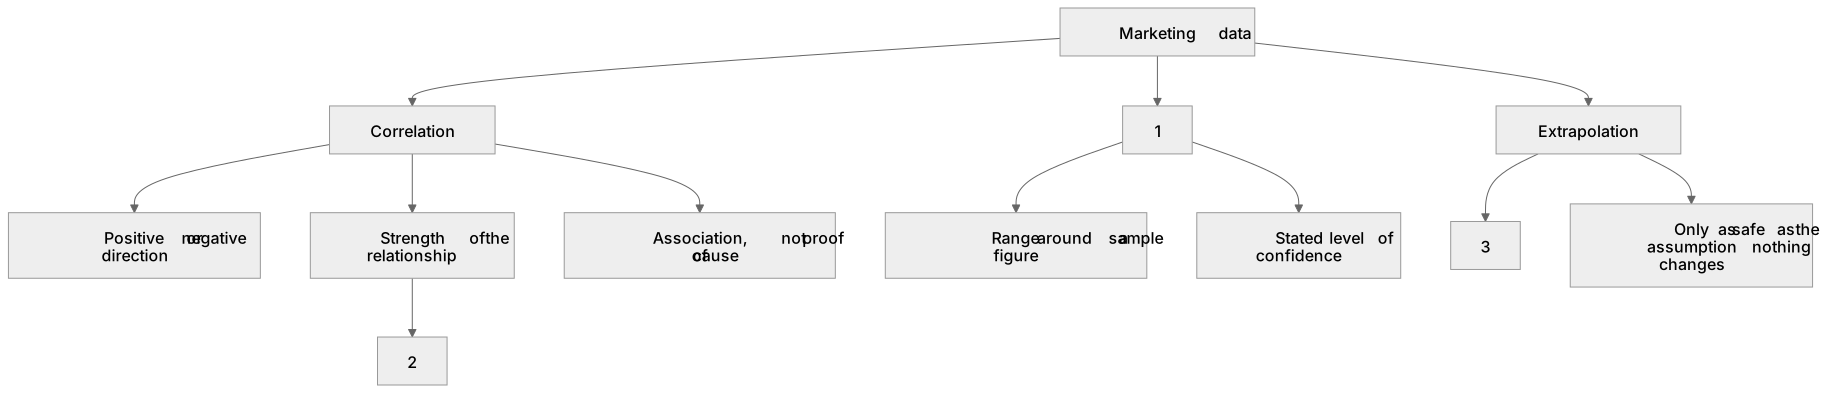
1Box 1
2Box 2
3Box 3
There is more to this lesson
The full lesson goes on to check your understanding and help you earn the marks. Create a free account to carry on, with your progress saved.
A week of Premium from your first lesson · Then the free plan continues · No card, no charge
Test your understanding of Understanding markets and customers: The interpretation of marketing data (to include: Interpretation of marketing data should include: positive and negative correlation and an understanding of the strength of the relationship, understanding the concept of confidence intervals, understanding extrapolation.)
Active recall beats re-reading. Take an instant quiz now to test what you’ve learned and lock it into long-term memory.
A week of Premium from your first lesson · Then the free plan continues · No card, no charge