Application of Economic Concepts to Real-World Scenarios Revision Notes

    Subject: Economics | Level: GCSE | Exam Board: OCR

    This guide focuses on the crucial skill of applying economic theory to real-world scenarios, a key requirement for success in OCR GCSE Economics. Master the art of using data and building analytical arguments to secure top marks in your exams.

    Revision Notes & Key Concepts

    ![Header image for Applying Economic Concepts](https://xnnrgnazirrqvdgfhvou.supabase.co/storage/v1/object/public/study-guide-assets/guide_736c0357-7bc8-4221-9907-bdd79434bde1/header_image.png) ## Overview Welcome to your essential guide for mastering Application of Economic Concepts (AO2) for the OCR J205 GCSE Economics specification. This skill is not just about knowing definitions; it’s about acting as an economist, using theoretical knowledge to analyse real-world situations presented in unseen case studies and data. Examiners are looking for candidates who can build logical chains of reasoning, integrating quantitative evidence to support their arguments. This guide will equip you with the frameworks, techniques, and practice needed to excel in the 35% of the exam dedicated to this assessment objective. We will deconstruct common mistakes, provide clear structures for answering questions, and show you how to connect different parts of the specification for a synoptic understanding. By the end of this guide, you will be able to confidently dissect any scenario the exam throws at you, from analysing the impact of a sugar tax on the soft drinks market to evaluating the effects of an interest rate change on the UK economy. ![Podcast: Mastering Application in GCSE Economics](https://xnnrgnazirrqvdgfhvou.supabase.co/storage/v1/object/public/study-guide-assets/guide_736c0357-7bc8-4221-9907-bdd79434bde1/application_of_economic_concepts_podcast.wav) ## The Core Analytical Framework Examiners expect a structured approach to your analysis. The most effective way to demonstrate this is by using a three-stage framework. This ensures your answer is logical, developed, and hits the key assessment criteria. ![The Three-Stage Framework for Economic Analysis](https://xnnrgnazirrqvdgfhvou.supabase.co/storage/v1/object/public/study-guide-assets/guide_736c0357-7bc8-4221-9907-bdd79434bde1/economic_analysis_framework.png) ### 1. Cause (The Economic Stimulus) This is the starting point. You must identify the initial event or change from the source material. It could be a change in government policy (e.g., a new environmental tax), a shift in market conditions (e.g., a rise in consumer incomes), or an external shock (e.g., a global pandemic). ### 2. Transmission Mechanism (The Chain of Reasoning) This is the heart of your analysis. You must explain *how* the initial cause ripples through the economy. This involves using economic theory to explain the step-by-step process. For example, if the cause is a decrease in income tax, the transmission mechanism would be: lower income tax → higher disposable income → increased consumer spending → outward shift in Aggregate Demand. ### 3. Consequence (The Final Impact) This is the end result. What is the ultimate effect on key economic variables like price, quantity, employment, economic growth, or inflation? It is vital here to reference the specific context. For instance, instead of saying 'prices rise', you should state 'the price of second-hand cars is likely to increase'. ## Common Pitfalls & How to Avoid Them ### Movement vs. Shift One of the most frequent errors is confusing a movement along a curve with a shift of the entire curve. Getting this right is fundamental. ![Movement Along vs. Shift of the Demand Curve](https://xnnrgnazirrqvdgfhvou.supabase.co/storage/v1/object/public/study-guide-assets/guide_736c0357-7bc8-4221-9907-bdd79434bde1/supply_demand_shift_diagram.png) * **Movement Along the Curve**: Caused *only* by a change in the price of the good itself. A price rise causes a contraction in demand (movement up the curve); a price fall causes an extension in demand (movement down the curve). * **Shift of the Curve**: Caused by a change in any non-price factor. For demand, this includes changes in income, advertising, the price of substitutes/complements, or fashion. For supply, this includes changes in costs of production, technology, or government subsidies. ### Inflation, Disinflation, and Deflation Candidates often use these terms incorrectly. Precision is vital. ![Inflation vs. Disinflation vs. Deflation](https://xnnrgnazirrqvdgfhvou.supabase.co/storage/v1/object/public/study-guide-assets/guide_736c0357-7bc8-4221-9907-bdd79434bde1/inflation_deflation_diagram.png) * **Inflation**: A sustained increase in the general price level. Prices are rising. * **Disinflation**: A fall in the rate of inflation. Prices are still rising, but more slowly than before (e.g., inflation falling from 5% to 2%). * **Deflation**: A sustained decrease in the general price level. Prices are falling (i.e., negative inflation). > **Examiner Tip**: Never state that disinflation means prices are falling. This is a guaranteed way to lose marks. It simply means the rate of price increase is slowing down.

    Key Terms & Definitions

    Price Elasticity of Demand (PED)
    A measure of the responsiveness of quantity demanded to a change in price.
    Negative Externality
    A cost imposed on a third party who is not directly involved in the production or consumption of a good.
    Aggregate Demand (AD)
    The total demand for all goods and services in an economy at a given price level.
    Monetary Policy
    Actions undertaken by a central bank to manipulate the money supply and credit conditions to stimulate or restrain economic activity.
    Fiscal Policy
    The use of government spending and taxation to influence the economy.
    Supply-Side Policy
    Government policies aimed at increasing the productive potential of the economy, shifting the long-run aggregate supply curve to the right.

    Worked Examples

    Practice Questions

    Application of Economic Concepts to Real-World Scenarios

    OCR
    GCSE
    Economics

    This guide focuses on the crucial skill of applying economic theory to real-world scenarios, a key requirement for success in OCR GCSE Economics. Master the art of using data and building analytical arguments to secure top marks in your exams.

    5
    Min Read
    3
    Examples
    5
    Questions
    6
    Key Terms
    🎙 Podcast Episode
    Application of Economic Concepts to Real-World Scenarios
    0:00-0:00

    Study Notes

    Header image for Applying Economic Concepts

    Overview

    Welcome to your essential guide for mastering Application of Economic Concepts (AO2) for the OCR J205 GCSE Economics specification. This skill is not just about knowing definitions; it’s about acting as an economist, using theoretical knowledge to analyse real-world situations presented in unseen case studies and data. Examiners are looking for candidates who can build logical chains of reasoning, integrating quantitative evidence to support their arguments. This guide will equip you with the frameworks, techniques, and practice needed to excel in the 35% of the exam dedicated to this assessment objective. We will deconstruct common mistakes, provide clear structures for answering questions, and show you how to connect different parts of the specification for a synoptic understanding. By the end of this guide, you will be able to confidently dissect any scenario the exam throws at you, from analysing the impact of a sugar tax on the soft drinks market to evaluating the effects of an interest rate change on the UK economy.

    Podcast: Mastering Application in GCSE Economics

    The Core Analytical Framework

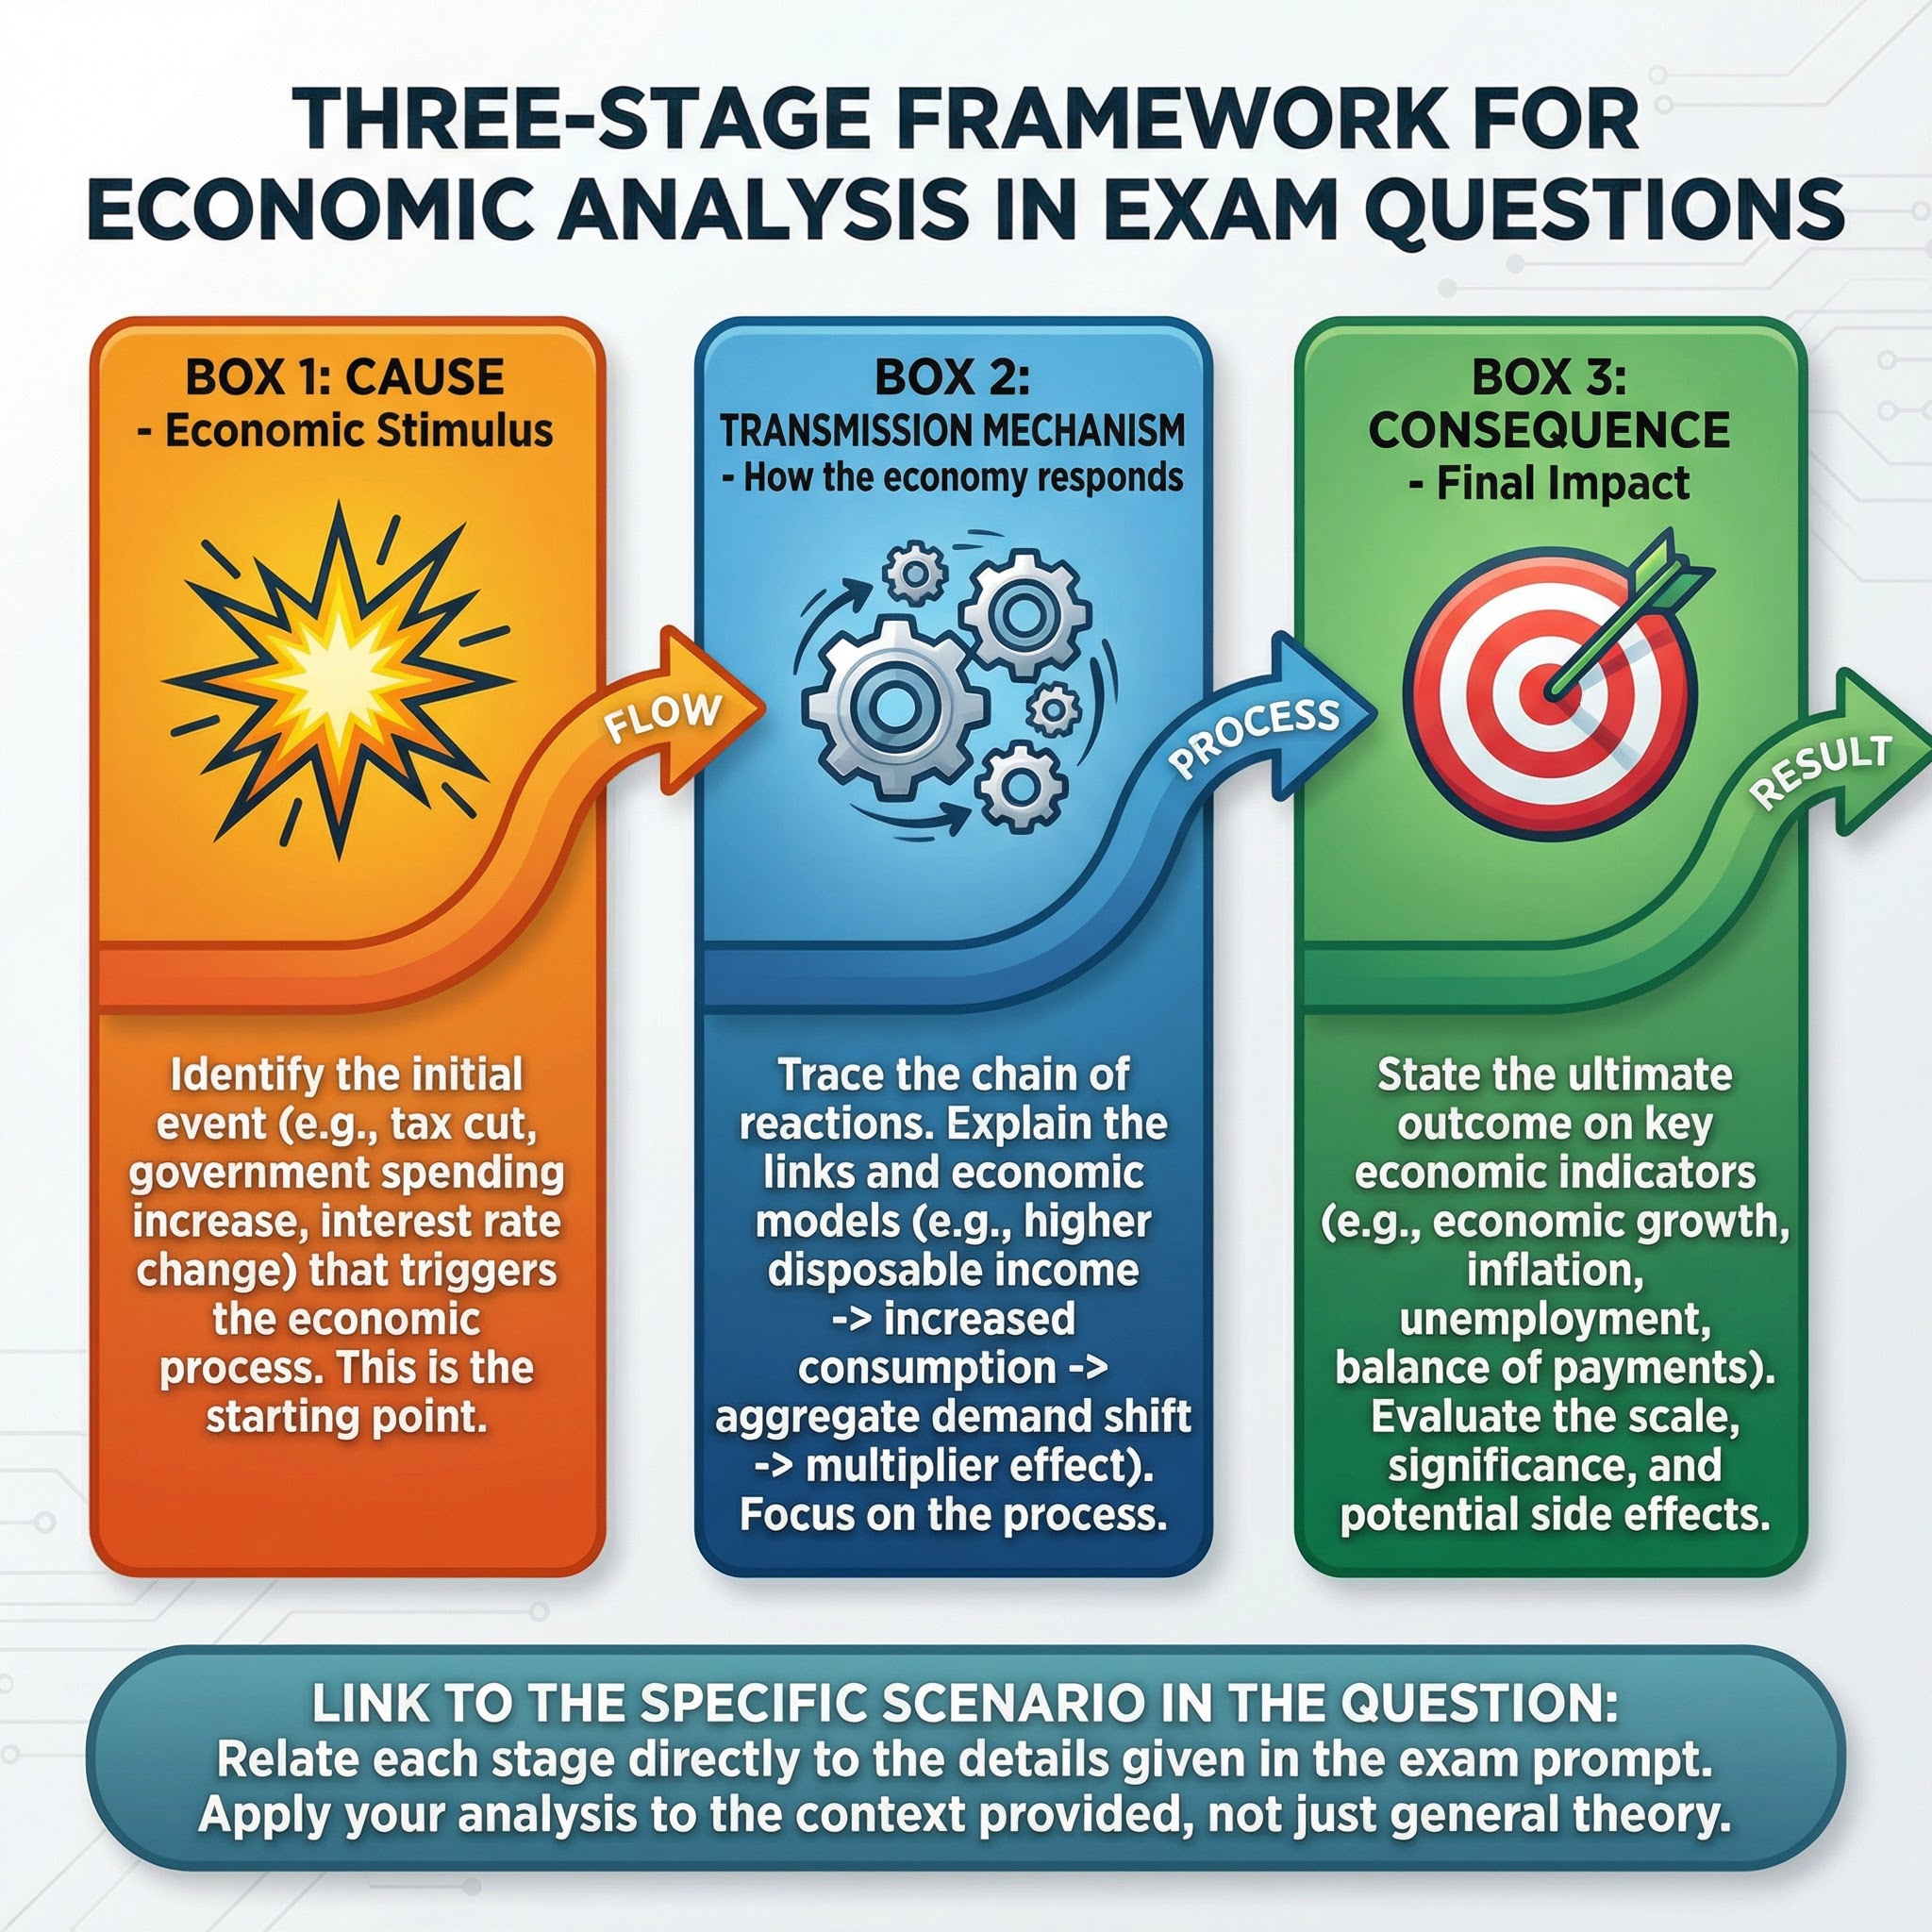
    Examiners expect a structured approach to your analysis. The most effective way to demonstrate this is by using a three-stage framework. This ensures your answer is logical, developed, and hits the key assessment criteria.
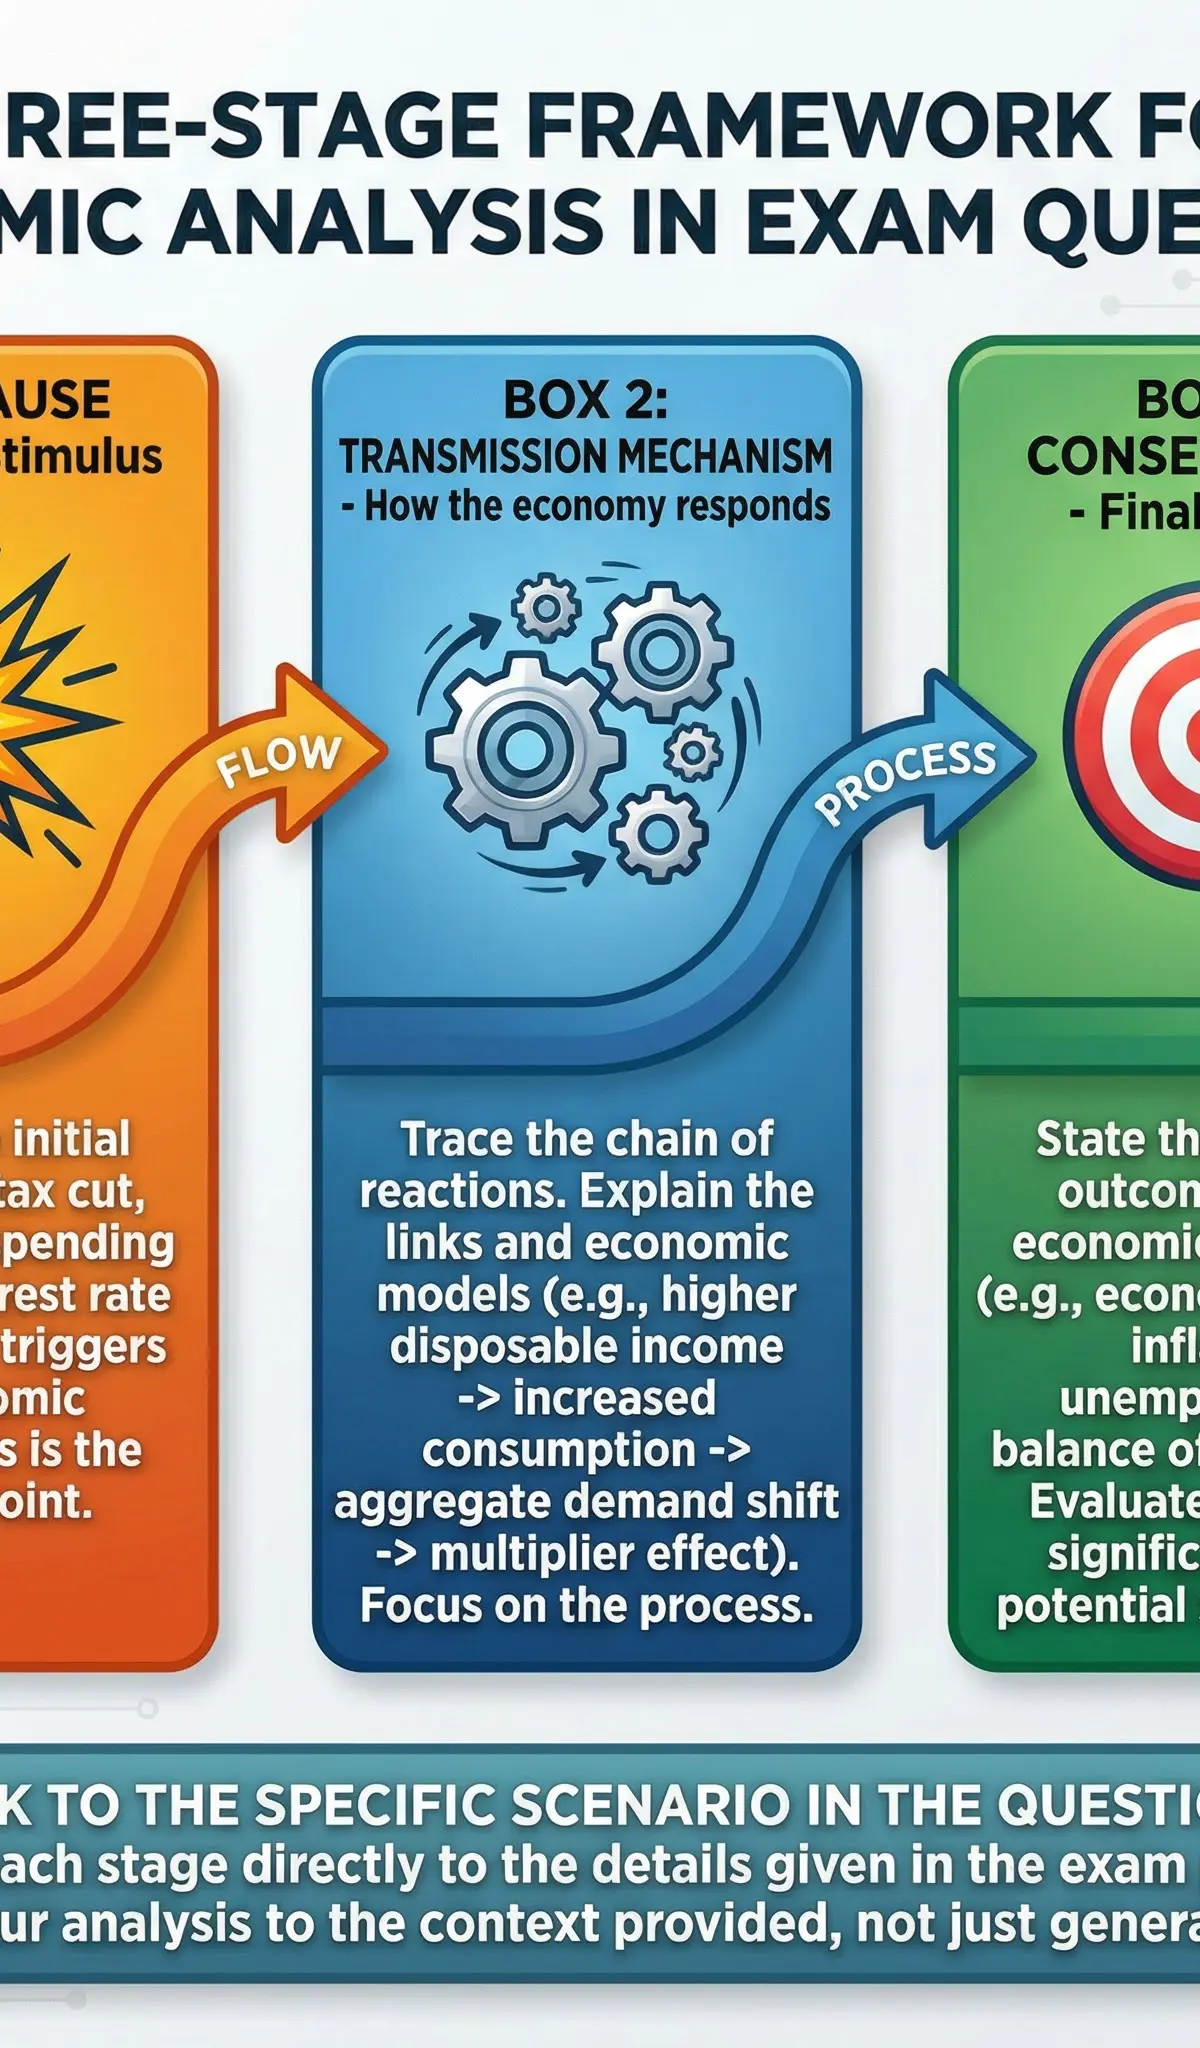
    The Three-Stage Framework for Economic Analysis

    1. Cause (The Economic Stimulus)

    This is the starting point. You must identify the initial event or change from the source material. It could be a change in government policy (e.g., a new environmental tax), a shift in market conditions (e.g., a rise in consumer incomes), or an external shock (e.g., a global pandemic).

    2. Transmission Mechanism (The Chain of Reasoning)

    This is the heart of your analysis. You must explain how the initial cause ripples through the economy. This involves using economic theory to explain the step-by-step process. For example, if the cause is a decrease in income tax, the transmission mechanism would be: lower income tax → higher disposable income → increased consumer spending → outward shift in Aggregate Demand.

    3. Consequence (The Final Impact)

    This is the end result. What is the ultimate effect on key economic variables like price, quantity, employment, economic growth, or inflation? It is vital here to reference the specific context. For instance, instead of saying 'prices rise', you should state 'the price of second-hand cars is likely to increase'.

    Common Pitfalls & How to Avoid Them

    Movement vs. Shift

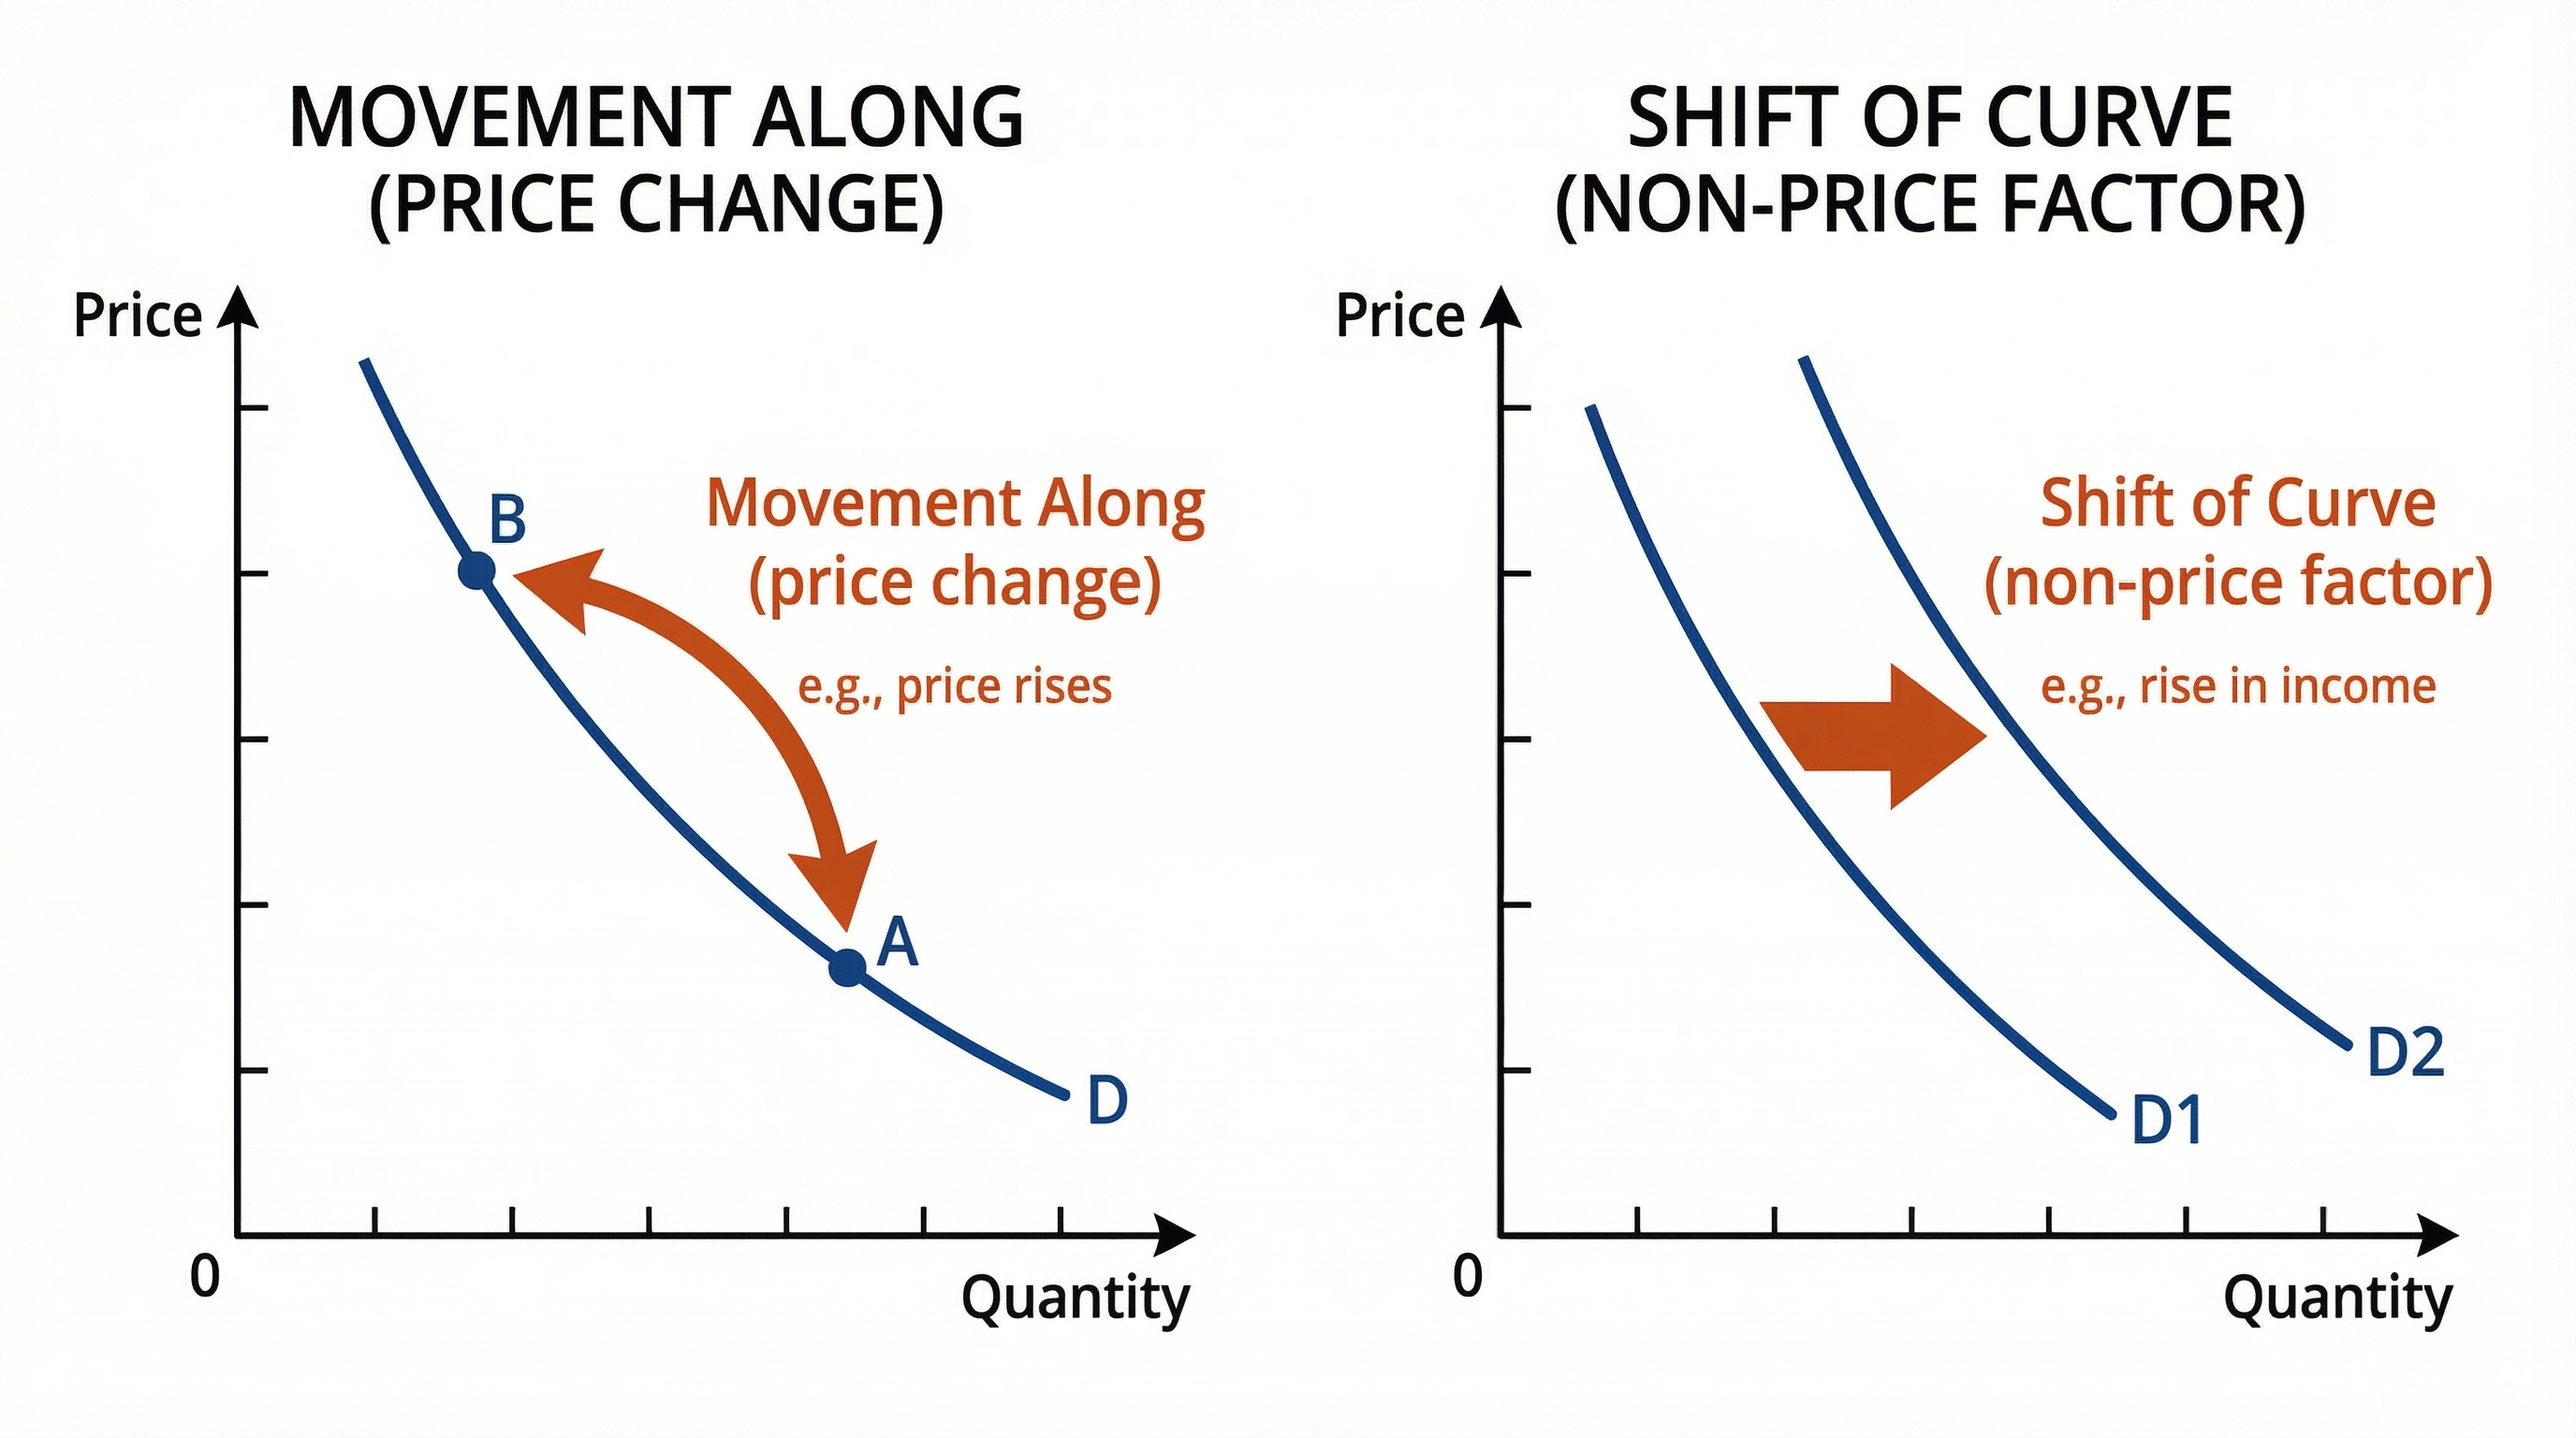
    One of the most frequent errors is confusing a movement along a curve with a shift of the entire curve. Getting this right is fundamental.
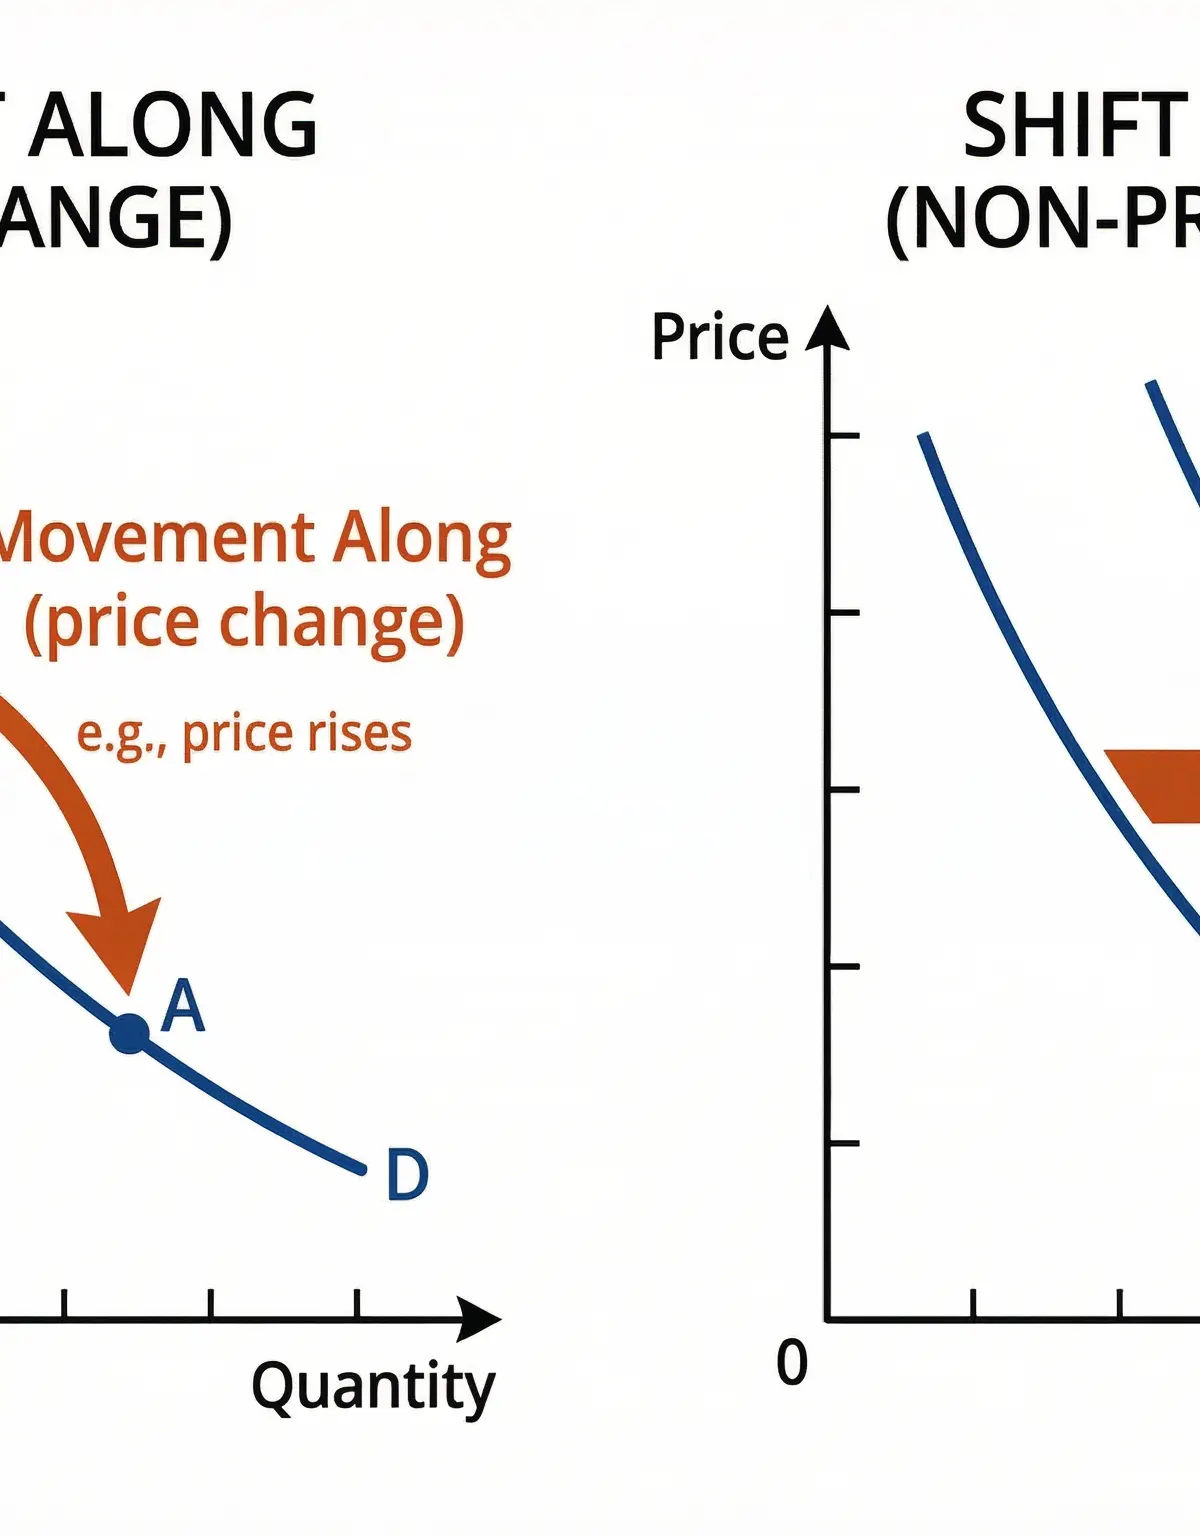
    Movement Along vs. Shift of the Demand Curve

    • Movement Along the Curve: Caused only by a change in the price of the good itself. A price rise causes a contraction in demand (movement up the curve); a price fall causes an extension in demand (movement down the curve).
    • Shift of the Curve: Caused by a change in any non-price factor. For demand, this includes changes in income, advertising, the price of substitutes/complements, or fashion. For supply, this includes changes in costs of production, technology, or government subsidies.

    Inflation, Disinflation, and Deflation

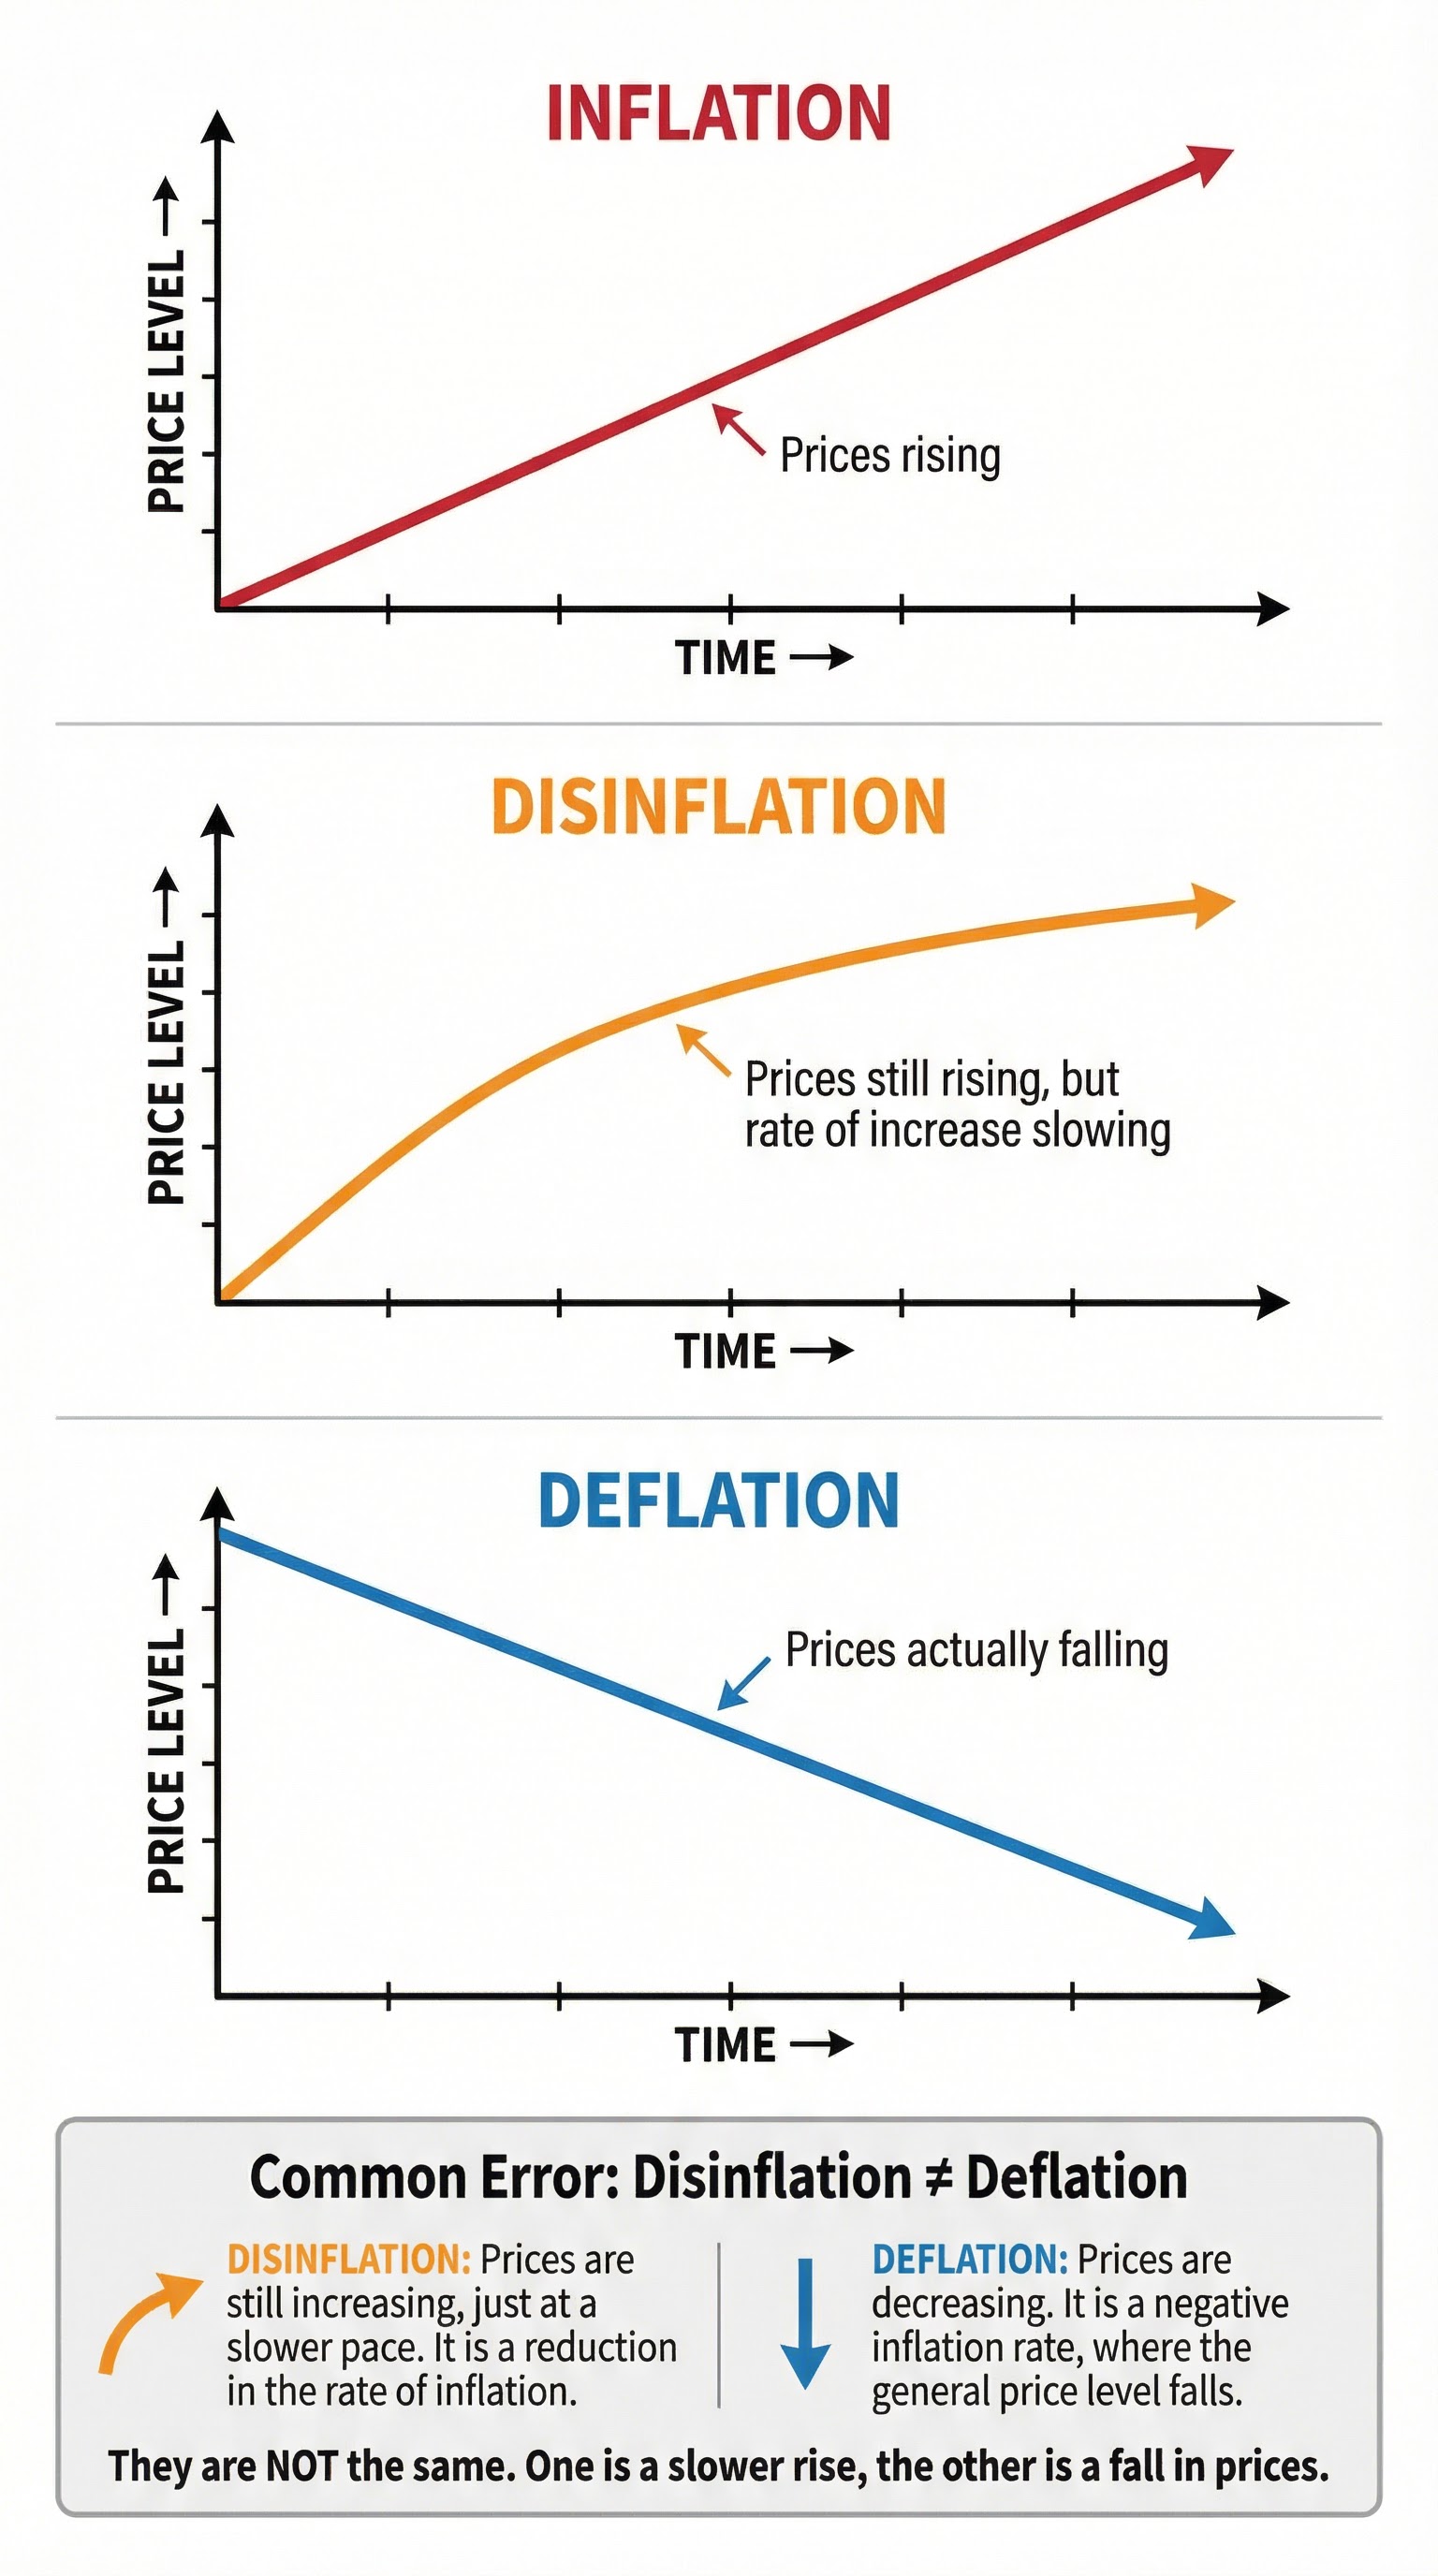
    Candidates often use these terms incorrectly. Precision is vital.
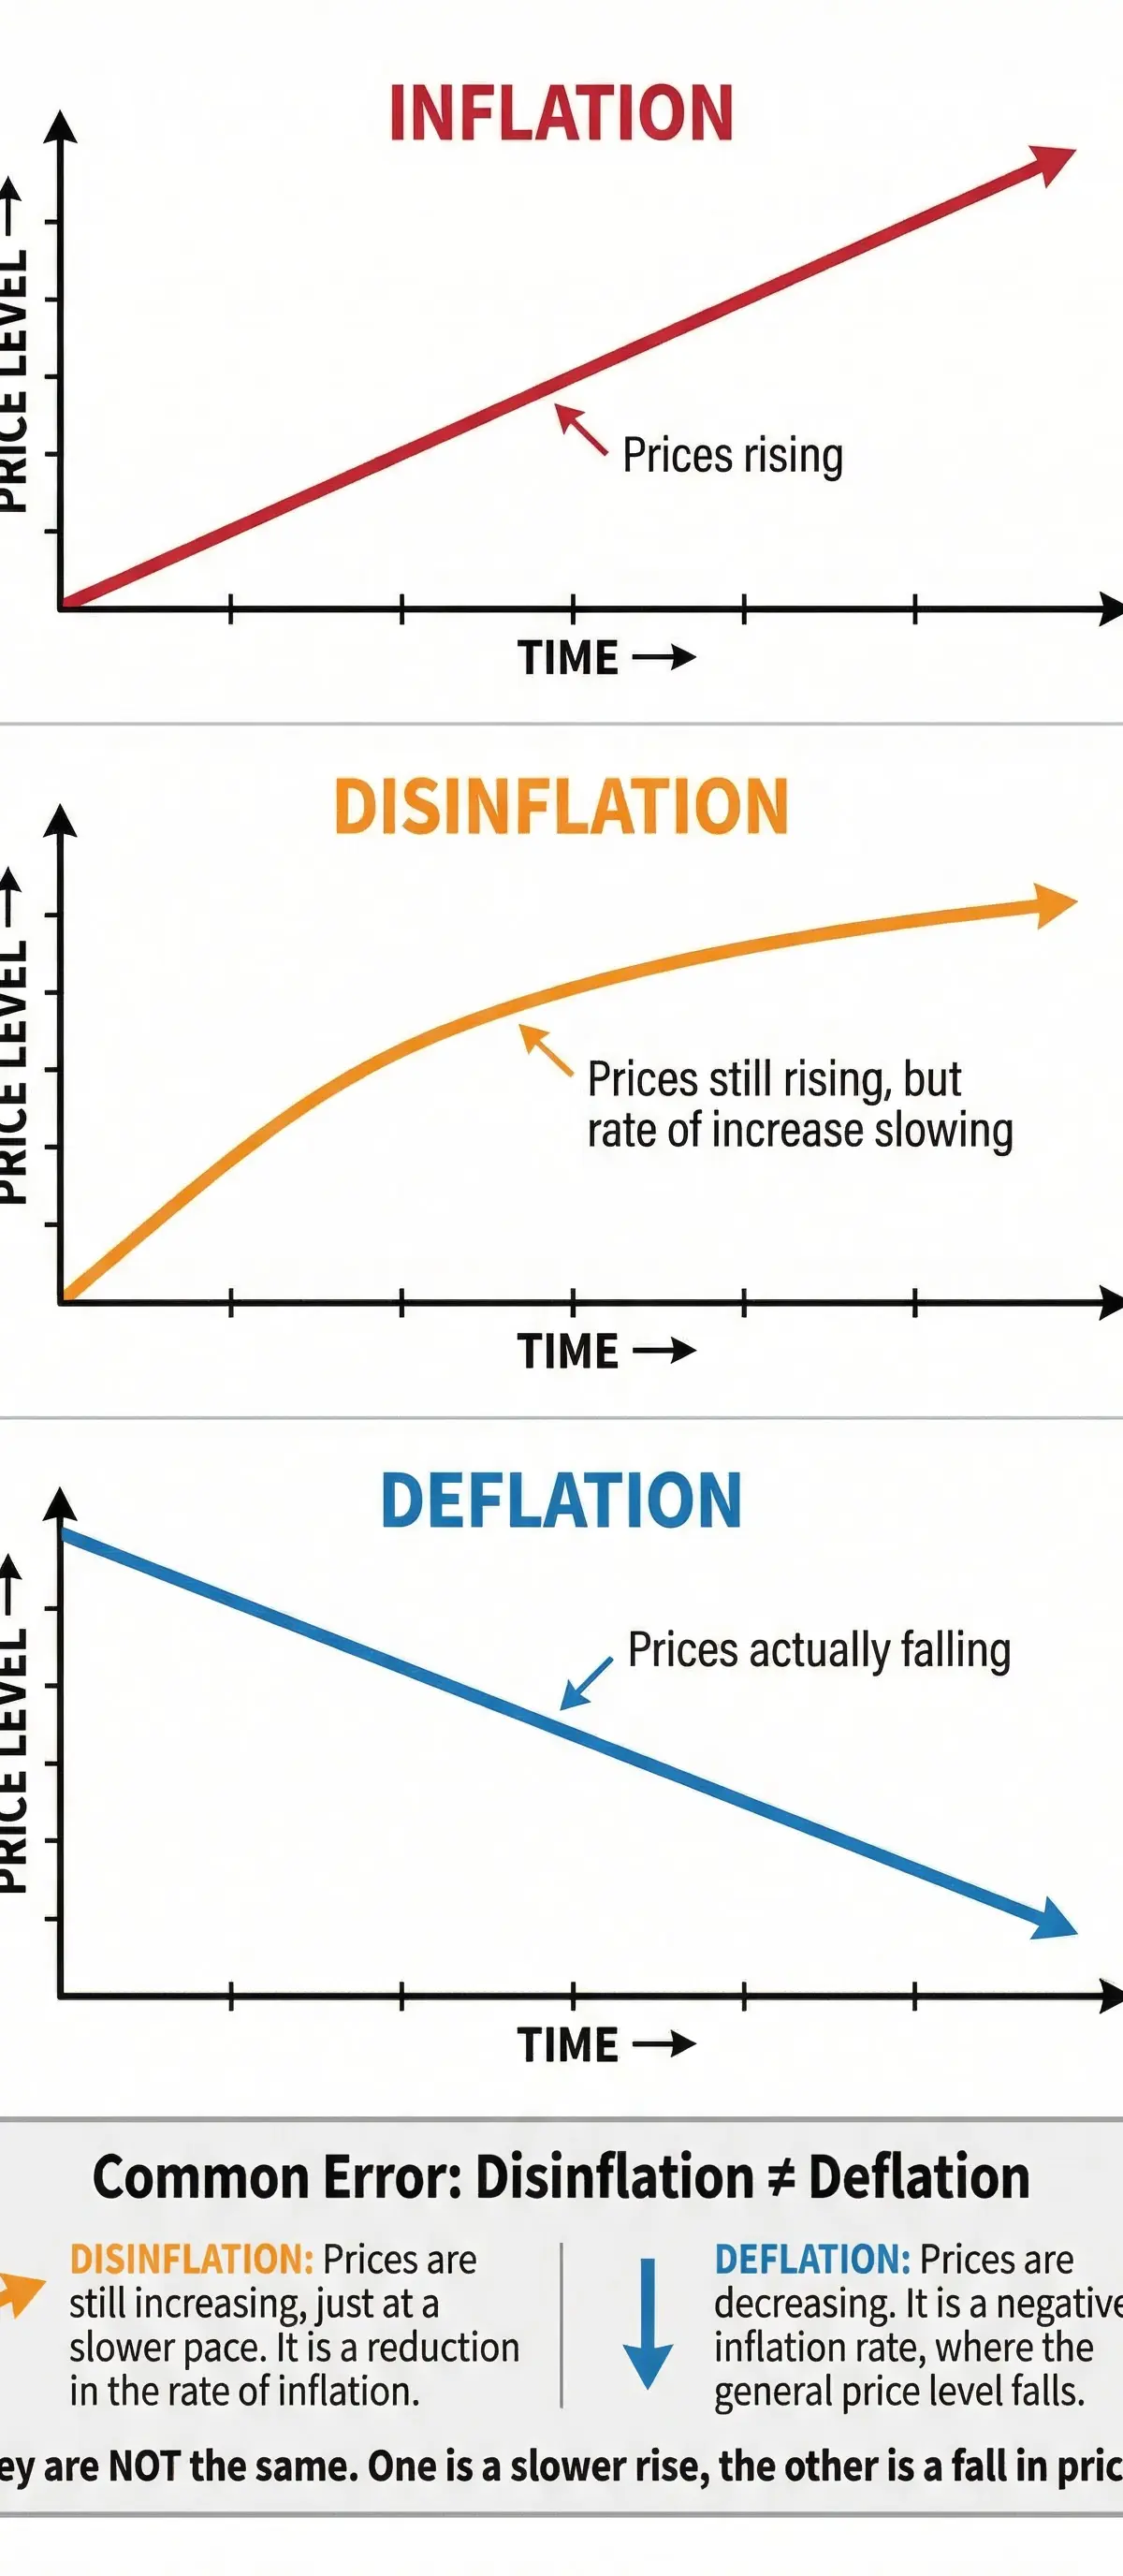
    Inflation vs. Disinflation vs. Deflation

    • Inflation: A sustained increase in the general price level. Prices are rising.
    • Disinflation: A fall in the rate of inflation. Prices are still rising, but more slowly than before (e.g., inflation falling from 5% to 2%).
    • Deflation: A sustained decrease in the general price level. Prices are falling (i.e., negative inflation).

    Examiner Tip: Never state that disinflation means prices are falling. This is a guaranteed way to lose marks. It simply means the rate of price increase is slowing down.

    Visual Resources

    3 diagrams and illustrations
    The Three-Stage Framework for Economic Analysis
    The Three-Stage Framework for Economic Analysis
    Movement Along vs. Shift of the Demand Curve
    Movement Along vs. Shift of the Demand Curve
    Inflation vs. Disinflation vs. Deflation
    Inflation vs. Disinflation vs. Deflation

    Interactive Diagrams

    1 interactive diagram to visualise key concepts

    Chain of reasoning for an indirect tax.

    Worked Examples

    3 detailed examples with solutions and examiner commentary

    Practice Questions

    Test your understanding — click to reveal model answers

    Q1

    Analyse how the growing popularity of electric cars might affect the market for petrol.

    6 marks
    standard

    Hint: Consider the relationship between the two goods. Are they substitutes or complements? Develop two distinct points.

    Q2

    A clothing retailer sees a 10% increase in price lead to a 25% fall in quantity demanded for its premium jackets. Calculate the PED for these jackets and explain what the result means.

    4 marks
    standard

    Hint: Use the PED formula: % Change in Quantity Demanded / % Change in Price.

    Q3

    Explain two potential benefits to the UK economy of a depreciation in the value of the pound (£).

    6 marks
    hard

    Hint: Think about the impact on exports and imports. Use the acronym SPICED (Strong Pound Imports Cheaper, Exports Dearer).

    Q4

    Evaluate the economic effects of a national minimum wage set above the equilibrium wage rate.

    9 marks
    hard

    Hint: Consider the impact on both workers and firms. Use a supply and demand diagram in your planning to visualise the effects.

    Q5

    Analyse how a government subsidy on electric buses could affect the market for public transport.

    6 marks
    standard

    Hint: A subsidy lowers costs for producers. How does this affect the supply curve?

    Explore this topic further

    View Topic PageAll Economics Topics

    Key Terms

    Essential vocabulary to know