OCR · A-Level · Psychology
Course version: H567 · Version from Sept 2015
D.1 – handling data: Calculate standard deviation.
Standard deviation is a measure of dispersion representing the square root of the mean squared deviation from the mean.
- Point 7 of 17
- 2 key terms
Study notes
From the teaching notes for this specification point.
The idea
Standard deviation is a measure of dispersion representing the square root of the mean squared deviation from the mean. It answers whether a condition produced a consistent effect or if one summary figure hides widely varying scores. Calculate it in fixed steps: find the mean, subtract it from each score to find the deviations, square each deviation so negatives stop cancelling, add the squared deviations, divide by n (or n-1 for a sample) to find the variance, and finally take the square root so the answer returns to the original units. The figure is highly useful comparatively; two experimental conditions might share a mean, but one group is tightly clustered (small standard deviation) while the other is spread out.
What earns the marks
- Define standard deviation as a measure of dispersion showing the square root of the variance, expressed in the original units.
- Outline the calculation method: find deviations from the mean, square them, sum the squares, divide by n (or n-1), and square root the result.
- Interpret the value: a small standard deviation indicates scores cluster closely around the mean, while a large one shows a wide spread of scores.
- Compare two conditions based on their spread as well as their means to comment on the consistency of the data.
Common mistakes and how to put them right
Leaving out the square root at the end and reporting the variance instead.
Put it right: Take the square root as the final step so the figure returns to the original units.
Adding the deviations before squaring them.
Put it right: This causes positive and negative departures to cancel out to zero; you must square each deviation first.
Believing that dividing by n-1 is incorrect.
Put it right: In psychology, dividing by n-1 is the standard formula for sample standard deviation, though OCR accepts dividing by n or n-1 without penalty.
Exam tips
- Calculation items carry method marks, so set the work out in labelled columns (score, deviation, squared deviation) and show all steps clearly.
- If asked why standard deviation is preferred to the range, explain that the range relies on only the two extreme scores, whereas standard deviation uses every score in the dataset.
Try the lesson
The start of the D.1 – handling data: Calculate standard deviation. lesson, made from teaching notes for this specification point.
Have a go first
In a study of reaction times, a researcher calculates the sum of the squared deviations from the mean to be 144 for a sample of 10 participants. What is the sample standard deviation for this data?
Listen
Standard deviation is a measure of dispersion representing the square root of the mean squared deviation from the mean. It answers whether a condition produced a consistent effect or if one summary figure hides widely varying scores. Calculate it in fixed steps: find the mean, subtract it from each score to find the deviations, square each deviation so negatives stop cancelling, add the squared deviations, divide by n (or n-1 for a sample) to find the variance, and finally take the square root so the answer returns to the original units. The figure is highly useful comparatively; two experimental conditions might share a mean, but one group is tightly clustered (small standard deviation) while the other is spread out. A strong answer earns marks for these points. Define standard deviation as a measure of dispersion showing the square root of the variance, expressed in the original units. Outline the calculation method: find deviations from the mean, square them, sum the squares, divide by n (or n-1), and square root the result. Interpret the value: a small standard deviation indicates scores cluster closely around the mean, while a large one shows a wide spread of scores. Compare two conditions based on their spread as well as their means to comment on the consistency of the data. A common slip: Leaving out the square root at the end and reporting the variance instead. Instead, take the square root as the final step so the figure returns to the original units. Exam tip: Calculation items carry method marks, so set the work out in labelled columns (score, deviation, squared deviation) and show all steps clearly.
See it
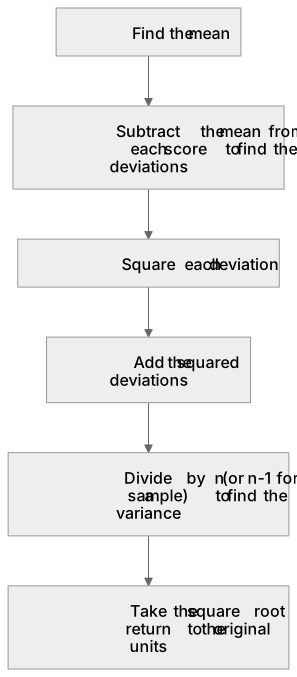
Put it in order
Put these steps in the order they happen.
- 1. Square each deviation
- 2. Subtract the mean from each score to find the deviations
- 3. Find the mean
- 4. Take the square root to return to the original units
- 5. Divide by n (or n-1 for a sample) to find the variance
- 6. Add the squared deviations
Key words
Say what each word means before you turn the card.
deviation from the mean
Try answering aloud or in your head before turning the card.
standard deviation
Try answering aloud or in your head before turning the card.
See every definition
- deviation from the mean
- Each score has the mean subtracted from it to find the deviations, which are then squared so negatives stop cancelling.
- standard deviation
- The square root of the variance, expressed in the original units, showing whether a condition produced a consistent effect.
Label the diagram
Some boxes have lost their names. Pick the right name for each number.
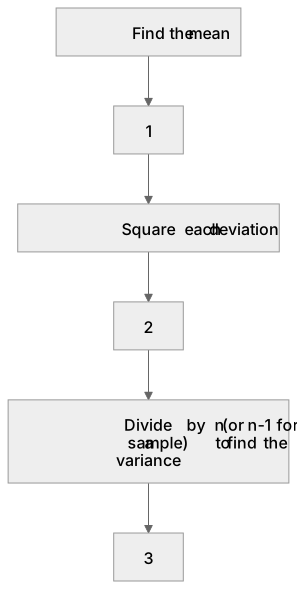
1Box 1
2Box 2
3Box 3
There is more to this lesson
The full lesson goes on to check your understanding and help you earn the marks. Create a free account to carry on, with your progress saved.
A week of Premium from your first lesson · Then the free plan continues · No card, no charge
Test your understanding of D.1 – handling data: Calculate standard deviation.
Active recall beats re-reading. Take an instant quiz now to test what you’ve learned and lock it into long-term memory.
A week of Premium from your first lesson · Then the free plan continues · No card, no charge