OCR · A-Level · Psychology
Course version: H567 · Version from Sept 2015
Use a scatter diagram to identify a correlation between two variables (to…
Full specification wording
D.1 – handling data: Use a scatter diagram to identify a correlation between two variables (to include: plotting two variables from an investigation on a scatter diagram and identifying the pattern as a positive correlation, a negative correlation or no correlation)
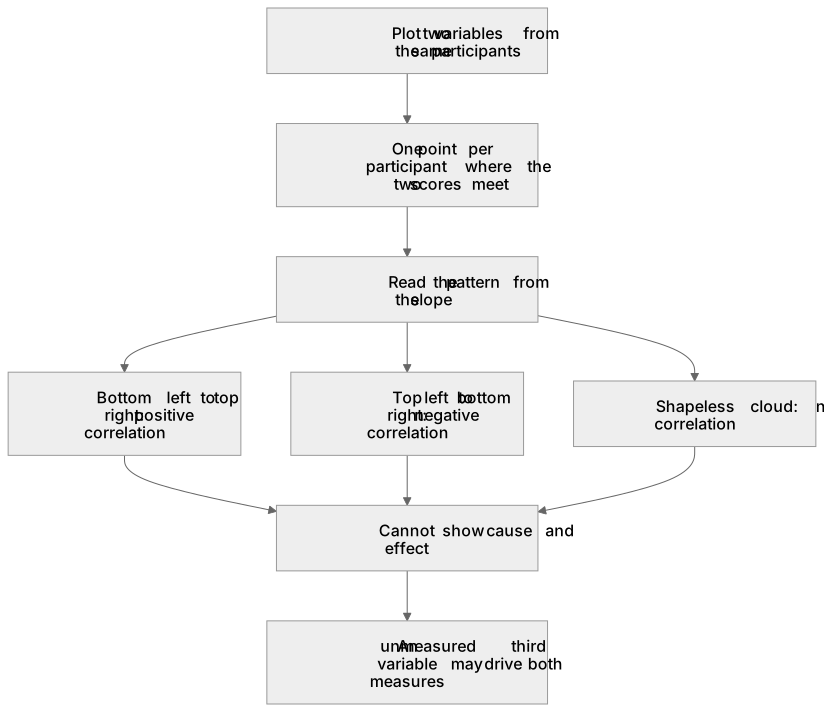
This is the picture a correlational design makes: one co-variable on each axis, one point for every participant placed where their two scores meet, and no line joining the points up.
- Point 8 of 17
- 3 key terms
Study notes
From the teaching notes for this specification point.
The idea
This is the picture a correlational design makes: one co-variable on each axis, one point for every participant placed where their two scores meet, and no line joining the points up. The pattern is read from the slope, so points running from bottom left to top right show that high scores on one measure go with high scores on the other, points running from top left to bottom right show that high on one goes with low on the other, and a shapeless cloud shows no relationship at all. Maguire and colleagues (2000) found that the volume of posterior hippocampal grey matter in London taxi drivers rose with the years they had spent driving a cab while anterior volume fell, which is one relationship of each direction in the same brain. Direction is not strength, and neither of them is cause.
What earns the marks
- The construction details, that both variables are measured from the same participants, that each axis carries the name of its variable and its units on an even scale, and that each participant contributes a single point.
- Naming the pattern in the words the board uses, a positive correlation, a negative correlation or no correlation, and pointing to the feature of the plot that justifies the label.
- Saying what the plot cannot show, that an unmeasured third variable may be driving both measures and that nothing in the picture fixes the direction of any influence.
- Linking the plot to a coefficient, so a value close to one in either direction matches points lying near a straight line and a value near zero matches a scattered cloud.
Common mistakes and how to put them right
Joining the points with a line or drawing a bar chart instead, which turns a correlation into a comparison of conditions the design never made.
Describing a negative correlation as no relationship, when a strong negative pattern is every bit as orderly as a strong positive one.
Writing that one variable caused the other because the points slope upwards, which is the error this whole topic exists to prevent.
Leaving the axes unlabelled, or starting one scale part way up with no break shown, so the pattern looks stronger than the data warrant.
Exam tips
- Sketching items are marked on the axes and on the spread of points, so label both axes with the co-variables named in the stem before plotting anything.
- Where the command is to identify the type of correlation, one phrase answers it, but the follow up nearly always asks what that means for the two measures in that study.
- Keep a cause and effect caution ready and phrase it with the actual variables from the stem rather than as a memorised slogan.
Try the lesson
The start of the D.1 – handling data: Use a scatter diagram to identify a correlation between two variables (to include: plotting two variables from an investigation on a scatter diagram and identifying the pattern as a positive correlation, a negative correlation or no correlation) lesson, made from teaching notes for this specification point.
Have a go first
A researcher plots a scatter diagram where the data points start at the bottom left of the graph and form a clear diagonal pattern going towards the top right. What type of correlation does this pattern identify?
Listen
This is the picture a correlational design makes: one co-variable on each axis, one point for every participant placed where their two scores meet, and no line joining the points up. The pattern is read from the slope, so points running from bottom left to top right show that high scores on one measure go with high scores on the other, points running from top left to bottom right show that high on one goes with low on the other, and a shapeless cloud shows no relationship at all. Maguire and colleagues (2000) found that the volume of posterior hippocampal grey matter in London taxi drivers rose with the years they had spent driving a cab while anterior volume fell, which is one relationship of each direction in the same brain. Direction is not strength, and neither of them is cause. A strong answer earns marks for these points. the construction details, that both variables are measured from the same participants, that each axis carries the name of its variable and its units on an even scale, and that each participant contributes a single point. Naming the pattern in the words the board uses, a positive correlation, a negative correlation or no correlation, and pointing to the feature of the plot that justifies the label. Saying what the plot cannot show, that an unmeasured third variable may be driving both measures and that nothing in the picture fixes the direction of any influence. Linking the plot to a coefficient, so a value close to one in either direction matches points lying near a straight line and a value near zero matches a scattered cloud. Exam tip: Sketching items are marked on the axes and on the spread of points, so label both axes with the co-variables named in the stem before plotting anything.
See it
Key words
Say what each word means before you turn the card.
correlational design
Try answering aloud or in your head before turning the card.
co-variables
Try answering aloud or in your head before turning the card.
third variable problem
Try answering aloud or in your head before turning the card.
See every definition
- correlational design
- A design in which both variables are measured from the same participants, with one co-variable on each axis of a scatter diagram.
- co-variables
- The two variables measured from the same participants, each carrying its name and units on an evenly scaled axis of the scatter diagram.
- third variable problem
- An unmeasured third variable may be driving both measures, and nothing in the picture fixes the direction of any influence.
Label the diagram
Some boxes have lost their names. Pick the right name for each number.
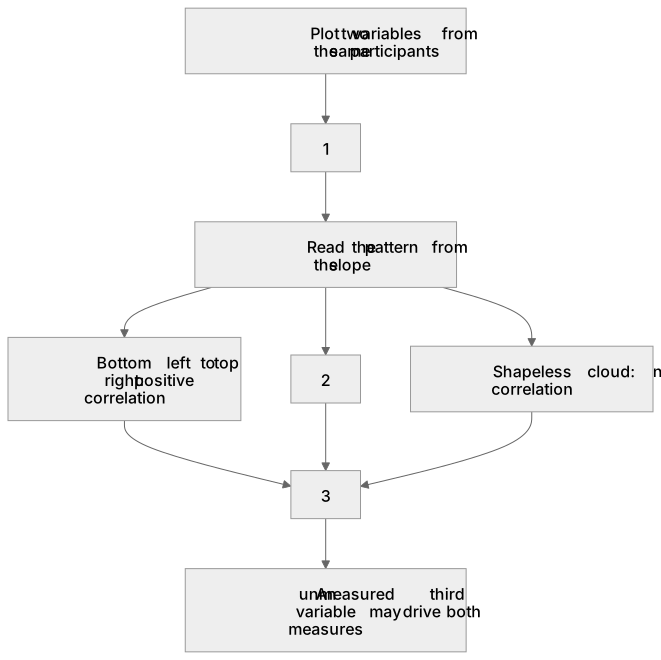
1Box 1
2Box 2
3Box 3
There is more to this lesson
The full lesson goes on to check your understanding and help you earn the marks. Create a free account to carry on, with your progress saved.
A week of Premium from your first lesson · Then the free plan continues · No card, no charge
Test your understanding of D.1 – handling data: Use a scatter diagram to identify a correlation between two variables (to include: plotting two variables from an investigation on a scatter diagram and identifying the pattern as a positive correlation, a negative correlation or no correlation)
Active recall beats re-reading. Take an instant quiz now to test what you’ve learned and lock it into long-term memory.
A week of Premium from your first lesson · Then the free plan continues · No card, no charge