OCR · A-Level · Psychology
Course version: H567 · Version from Sept 2015
Distinguish between levels of measurement (to include: stating the level…
Full specification wording
D.1 – handling data: Distinguish between levels of measurement (to include: stating the level of measurement (nominal, ordinal or interval) that has been used in a study)
The level of a measure describes what its numbers represent, driving decisions about summarising and testing.
- Point 11 of 17
- 4 key terms
Study notes
From the teaching notes for this specification point.
The idea
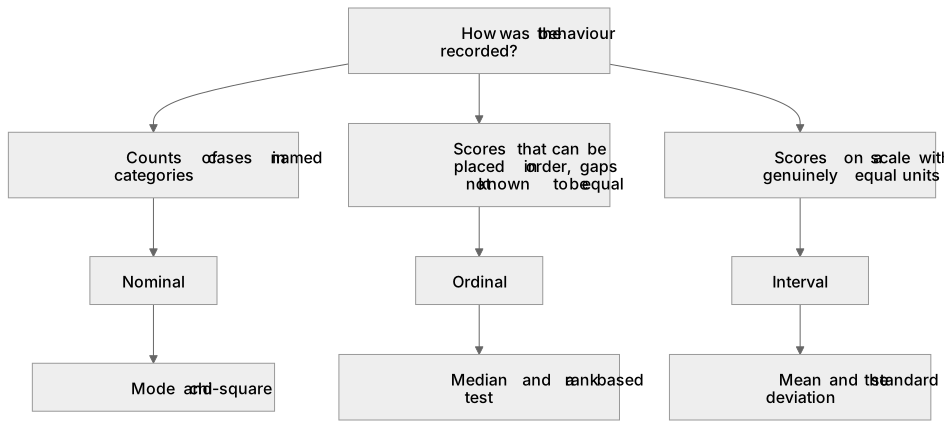
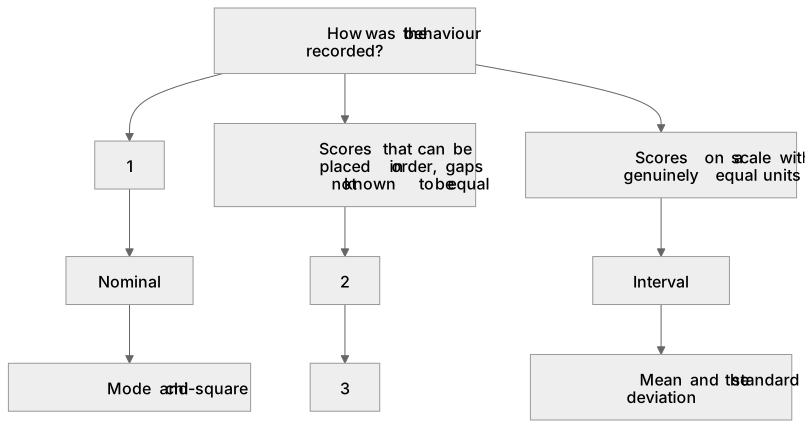
The level of a measure describes what its numbers represent, driving decisions about summarising and testing. Counts of cases in named categories are nominal, so the numbers label rather than measure and only frequencies can be compared, as when Simons and Chabris recorded how many observers noticed the unexpected event. Scores that can be placed in order but whose gaps are not known to be equal are ordinal, covering rankings and rating scales. Scores on a scale with genuinely equal units, such as time in seconds, are interval. Work out how the researcher recorded the behaviour before you state the level of measurement used in a study to distinguish between them accurately.
What earns the marks
- Linking the level to what follows from it, so nominal data allow the mode and chi-square, ordinal data allow the median and a rank based test, interval data allow the mean and the standard deviation.
- Recognising that the same behaviour can be measured at different levels depending on how it is recorded, so aggression scored as present or absent is nominal while aggression counted as acts per minute is interval.
Common mistakes and how to put them right
Calling any set of numbers interval because it looks numerical, when a rating out of ten on a self-report scale is still ordinal.
Confusing the categorical nature of nominal data with the quantitative frequency counts.
Put it right: Nominal data themselves are qualitative categories, while the counts of cases within them are quantitative.
Describing categories as ordinal because they happen to be listed in an order on the page rather than because the underlying measure has a genuine rank.
Exam tips
- The item often reads state the level of measurement used in this study, so name it clearly before writing your justification.
- When asked to justify the level of measurement, ensure your reasoning relates to the mathematical property of the scale rather than just the subject matter of the study.
Try the lesson
The start of the D.1 – handling data: Distinguish between levels of measurement (to include: stating the level of measurement (nominal, ordinal or interval) that has been used in a study) lesson, made from teaching notes for this specification point.
Have a go first
A psychologist records the eye colour of participants in a visual perception study, classifying them as blue, brown, green, or other. Which level of measurement has been used for this data?
Listen
The level of a measure describes what its numbers represent, driving decisions about summarising and testing. Counts of cases in named categories are nominal, so the numbers label rather than measure and only frequencies can be compared, as when Simons and Chabris recorded how many observers noticed the unexpected event. Scores that can be placed in order but whose gaps are not known to be equal are ordinal, covering rankings and rating scales. Scores on a scale with genuinely equal units, such as time in seconds, are interval. Work out how the researcher recorded the behaviour before you state the level of measurement used in a study to distinguish between them accurately. A strong answer earns marks for these points. definitions that separate the three: nominal data are frequencies in discrete named categories, ordinal data can be ranked but the gaps between points are not equal, and interval data sit on a scale with equal and defined units. Stating the level of measurement for the specific measure in the stem and saying why, for example that an agreement scale is ordinal because the distance between agree and strongly agree is not the same for every participant. Linking the level to what follows from it, so nominal data allow the mode and chi-square, ordinal data allow the median and a rank based test, interval data allow the mean and the standard deviation. Recognising that the same behaviour can be measured at different levels depending on how it is recorded, so aggression scored as present or absent is nominal while aggression counted as acts per minute is interval. Exam tip: The item often reads state the level of measurement used in this study, so name it clearly before writing your justification.
See it
Key words
Say what each word means before you turn the card.
nominal data
Try answering aloud or in your head before turning the card.
ordinal data
Try answering aloud or in your head before turning the card.
interval data
Try answering aloud or in your head before turning the card.
level of measurement
Try answering aloud or in your head before turning the card.
See every definition
- nominal data
- Frequencies in discrete named categories, where the numbers label rather than measure, so only frequencies can be compared.
- ordinal data
- Scores that can be placed in order but whose gaps are not known to be equal, covering rankings and rating scales.
- interval data
- Scores on a scale with genuinely equal and defined units, such as time in seconds.
- level of measurement
- What a measure's numbers represent, worked out from how the researcher recorded the behaviour before it is stated for a study.
Label the diagram
Some boxes have lost their names. Pick the right name for each number.
1Box 1
2Box 2
3Box 3
There is more to this lesson
The full lesson goes on to check your understanding and help you earn the marks. Create a free account to carry on, with your progress saved.
A week of Premium from your first lesson · Then the free plan continues · No card, no charge
Test your understanding of D.1 – handling data: Distinguish between levels of measurement (to include: stating the level of measurement (nominal, ordinal or interval) that has been used in a study)
Active recall beats re-reading. Take an instant quiz now to test what you’ve learned and lock it into long-term memory.
A week of Premium from your first lesson · Then the free plan continues · No card, no charge