OCR · A-Level · Psychology
Course version: H567 · Version from Sept 2015
Understand the differences between qualitative and quantitative data (to…
Full specification wording
D.1 – handling data: Understand the differences between qualitative and quantitative data (to include: explaining how a given qualitative measure (for example, an interview transcript) might be converted into quantitative data)
Numbers and words answer different questions, and the examinable skill is moving between them.
- Point 16 of 17
- 4 key terms
Study notes
From the teaching notes for this specification point.
The idea
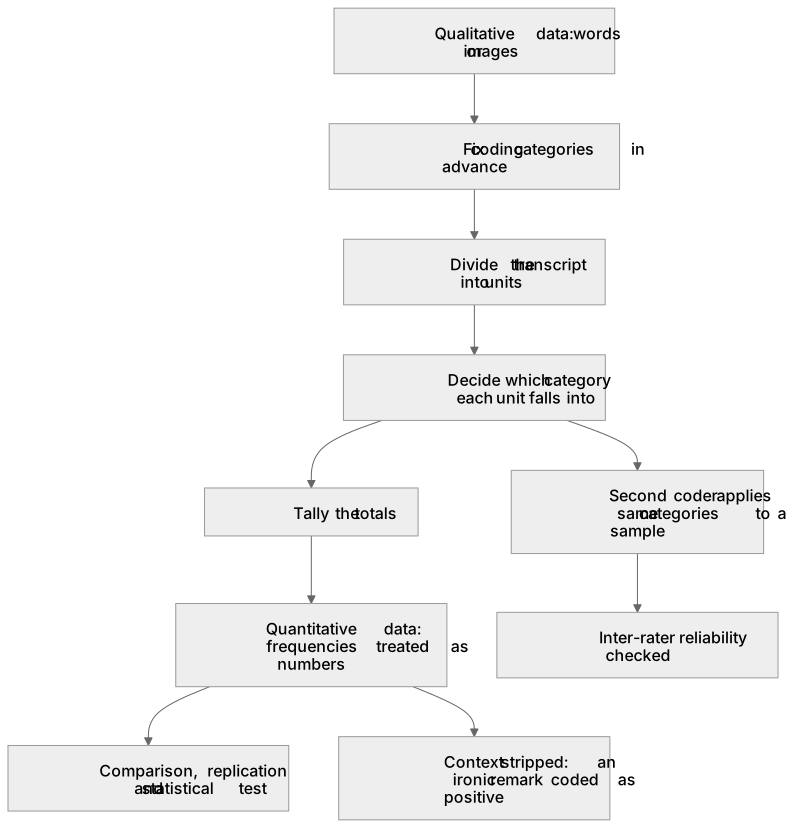
Numbers and words answer different questions, and the examinable skill is moving between them. Counted or measured scores can be averaged, graphed and tested for significance, which is how Baron-Cohen et al. (1997) compared eyes task scores between adults with autism and controls. Words, images and transcripts carry meaning and reasons that a score cannot, which makes Freud (1909) on Little Hans rich and unrepeatable. Content analysis is the bridge: the researcher fixes coding categories, breaks the material into units, decides which category each unit falls into and tallies the totals, much as Hancock et al. (2011) did in counting language features in the crime narratives of psychopathic and non-psychopathic murderers.
What earns the marks
- An example taken from the material in the stem, such as counting how often an interviewee mentions a named worry, or coding every answer as positive, neutral or negative and reporting the totals for each.
- Evaluation on both sides, that quantifying allows comparison, replication and a statistical test, but strips the context, so an ironic remark coded as positive shifts the result.
- Mentioning that a second coder applies the same categories to a sample of the material so that inter-rater reliability can be checked.
Common mistakes and how to put them right
Calling interviews qualitative and questionnaires quantitative.
Put it right: The method does not fix the data type, since a rating scale inside an interview yields numbers and an open box on a questionnaire yields words.
Describing content analysis as reading the transcript and noticing themes.
Put it right: Without categories agreed beforehand and a tally there is no quantitative data at the end.
Saying qualitative data are subjective and stopping there, when the mark comes from explaining that two researchers may read the same passage differently.
Treating the conversion as free of cost, and forgetting that a frequency count says how often something was said but not how strongly it was meant.
Exam tips
- This is normally a suggest item on an unfamiliar study: you are shown a transcript or an open question and asked how the data could be made numerical, so answer with categories plus a tally rather than with a definition.
- Plan one strength and one weakness of the conversion before writing, because the evaluation half usually carries as many marks as the method.
- Where a comparison is asked for, apply one criterion to both types, for example depth of detail against ease of analysis, instead of listing features separately.
Try the lesson
The start of the D.1 – handling data: Understand the differences between qualitative and quantitative data (to include: explaining how a given qualitative measure (for example, an interview transcript) might be converted into quantitative data) lesson, made from teaching notes for this specification point.
Have a go first
Which of the following best describes the fundamental difference between qualitative and quantitative data?
Listen
Numbers and words answer different questions, and the examinable skill is moving between them. Counted or measured scores can be averaged, graphed and tested for significance, which is how Baron-Cohen et al. (1997) compared eyes task scores between adults with autism and controls. Words, images and transcripts carry meaning and reasons that a score cannot, which makes Freud (1909) on Little Hans rich and unrepeatable. Content analysis is the bridge: the researcher fixes coding categories, breaks the material into units, decides which category each unit falls into and tallies the totals, much as Hancock et al. (2011) did in counting language features in the crime narratives of psychopathic and non-psychopathic murderers. A strong answer earns marks for these points. Definitions that do some work, that quantitative data are numerical and open to descriptive and inferential statistics, while qualitative data are non-numerical, in words or images, and are analysed by drawing out themes. Naming a real conversion procedure rather than gesturing at one, that the transcript is divided into units, the categories are operationalised in advance, each unit is coded and the frequencies are then treated as numbers. An example taken from the material in the stem, such as counting how often an interviewee mentions a named worry, or coding every answer as positive, neutral or negative and reporting the totals for each. Evaluation on both sides, that quantifying allows comparison, replication and a statistical test, but strips the context, so an ironic remark coded as positive shifts the result. Exam tip: This is normally a suggest item on an unfamiliar study: you are shown a transcript or an open question and asked how the data could be made numerical, so answer with categories plus a tally rather than with a definition.
See it
Key words
Say what each word means before you turn the card.
qualitative data
Try answering aloud or in your head before turning the card.
quantitative data
Try answering aloud or in your head before turning the card.
content analysis
Try answering aloud or in your head before turning the card.
inter-rater reliability
Try answering aloud or in your head before turning the card.
See every definition
- qualitative data
- Non-numerical data, in words or images, analysed by drawing out themes.
- quantitative data
- Numerical data that are open to descriptive and inferential statistics.
- content analysis
- The researcher fixes coding categories, breaks the material into units, decides which category each unit falls into and tallies the totals.
- inter-rater reliability
- Checked by a second coder applying the same categories to a sample of the material.
Label the diagram
Some boxes have lost their names. Pick the right name for each number.
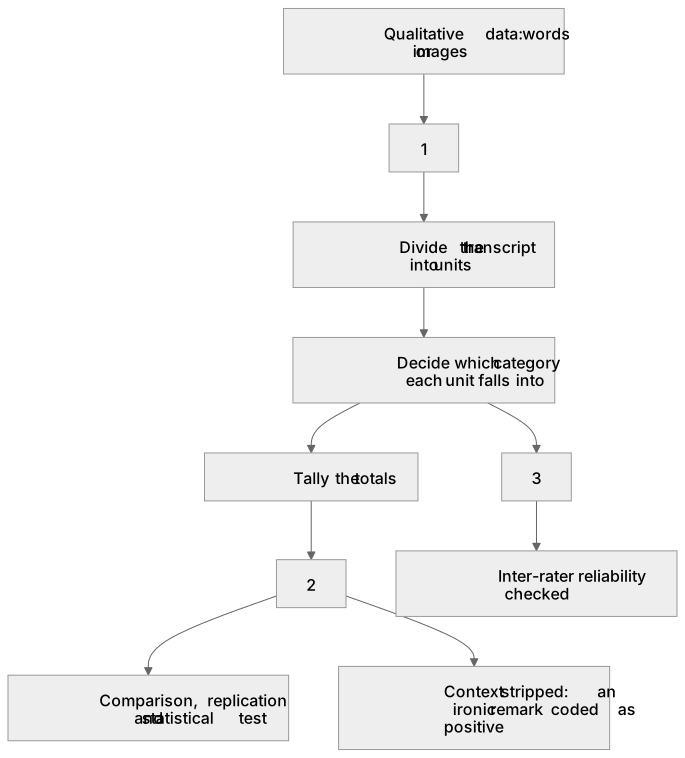
1Box 1
2Box 2
3Box 3
There is more to this lesson
The full lesson goes on to check your understanding and help you earn the marks. Create a free account to carry on, with your progress saved.
A week of Premium from your first lesson · Then the free plan continues · No card, no charge
Test your understanding of D.1 – handling data: Understand the differences between qualitative and quantitative data (to include: explaining how a given qualitative measure (for example, an interview transcript) might be converted into quantitative data)
Active recall beats re-reading. Take an instant quiz now to test what you’ve learned and lock it into long-term memory.
A week of Premium from your first lesson · Then the free plan continues · No card, no charge