OCR · A-Level · Psychology
Course version: H567 · Version from Sept 2015
Use an appropriate number of significant figures (to include: expressing a…
Full specification wording
D.1 – handling data: Use an appropriate number of significant figures (to include: expressing a correlation coefficient to two or three significant figures)
Significant figures are counted from the first non-zero digit.
- Point 1 of 17
- 4 key terms
Study notes
From the teaching notes for this specification point.
The idea
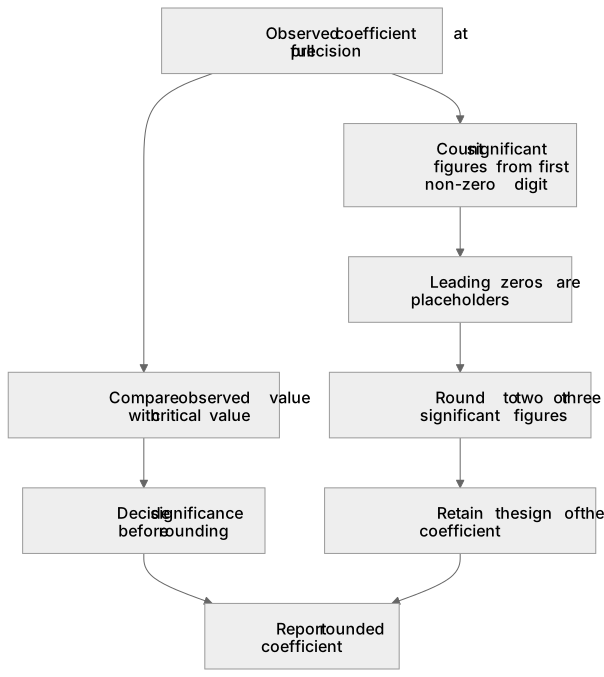
Significant figures are counted from the first non-zero digit. In a correlation coefficient of 0.06428, leading zeros are placeholders; the first significant figure is six. This rounds to 0.0643 (three significant figures) and 0.064 (two significant figures). Rounding examines the next digit, rounding up from five. Coefficients are expressed to two or three significant figures because excessive decimal places imply false precision. Crucially, compare observed and critical values before rounding. An observed Spearman's rho of 0.5638 against a critical value of 0.564 fails to reach significance, but rounding first to 0.564 would falsely suggest significance.
What earns the marks
- Count significant figures from the first non-zero digit; leading zeros in decimals (e.g., 0.045) are not significant.
- Retain the sign of a correlation coefficient when rounding; -0.837 to two significant figures is -0.84, maintaining the negative relationship.
- Compare the calculated observed value to the critical value at full precision before applying any rounding to determine significance.
- Justify the number of significant figures used by referencing the precision of the raw data or the critical value tables provided.
Common mistakes and how to put them right
Confusing significant figures with decimal places, incorrectly rounding 0.0479 to two significant figures as 0.05 (two decimal places) instead of 0.048.
Truncating instead of rounding, such as reducing 0.6666 to 0.66 for two significant figures rather than correctly rounding up to 0.67.
Rounding the observed value before comparing it with the critical value, which can incorrectly turn a non-significant result into a significant one.
Exam tips
- When a question provides an observed coefficient and a critical value, make the comparison using the exact precision given before rounding in your conclusion.
- Write your unrounded calculated value on one line, and then write the rounded value to two or three significant figures on the next line to secure accuracy marks.
Try the lesson
The start of the D.1 – handling data: Use an appropriate number of significant figures (to include: expressing a correlation coefficient to two or three significant figures) lesson, made from teaching notes for this specification point.
Have a go first
A psychologist calculates a Pearson's r correlation coefficient of 0.815. What is this value expressed to two significant figures?
Listen
Significant figures are counted from the first non-zero digit. In a correlation coefficient of 0.06428, leading zeros are placeholders; the first significant figure is six. This rounds to 0.0643 (three significant figures) and 0.064 (two significant figures). Rounding examines the next digit, rounding up from five. Coefficients are expressed to two or three significant figures because excessive decimal places imply false precision. Crucially, compare observed and critical values before rounding. An observed Spearman's rho of 0.5638 against a critical value of 0.564 fails to reach significance, but rounding first to 0.564 would falsely suggest significance. A strong answer earns marks for these points. Count significant figures from the first non-zero digit; leading zeros in decimals (e.g., 0.045) are not significant. Retain the sign of a correlation coefficient when rounding; -0.837 to two significant figures is -0.84, maintaining the negative relationship. Compare the calculated observed value to the critical value at full precision before applying any rounding to determine significance. Justify the number of significant figures used by referencing the precision of the raw data or the critical value tables provided. Exam tip: When a question provides an observed coefficient and a critical value, make the comparison using the exact precision given before rounding in your conclusion.
See it
Key words
Say what each word means before you turn the card.
significant figures
Try answering aloud or in your head before turning the card.
rounding conventions
Try answering aloud or in your head before turning the card.
correlation coefficients
Try answering aloud or in your head before turning the card.
critical value
Try answering aloud or in your head before turning the card.
See every definition
- significant figures
- Counted from the first non-zero digit, with leading zeros in decimals acting as placeholders and not significant.
- rounding conventions
- Rounding examines the next digit, rounding up from five, and the sign of a correlation coefficient is retained when rounding.
- correlation coefficients
- Expressed to two or three significant figures because excessive decimal places imply false precision.
- critical value
- The observed value is compared to it at full precision before applying any rounding to determine significance.
Label the diagram
Some boxes have lost their names. Pick the right name for each number.
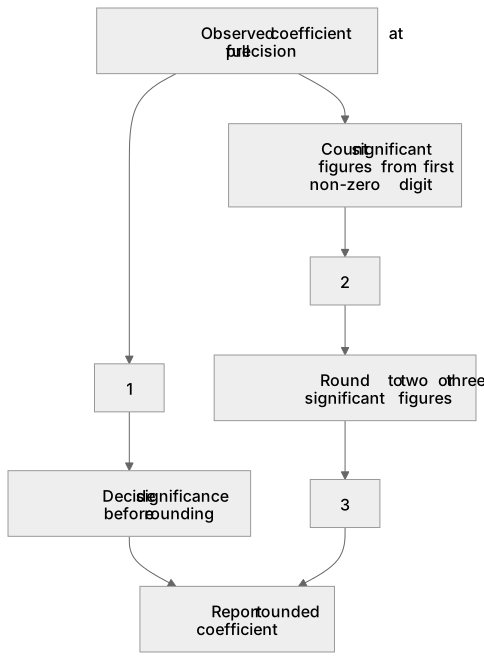
1Box 1
2Box 2
3Box 3
There is more to this lesson
The full lesson goes on to check your understanding and help you earn the marks. Create a free account to carry on, with your progress saved.
A week of Premium from your first lesson · Then the free plan continues · No card, no charge
Test your understanding of D.1 – handling data: Use an appropriate number of significant figures (to include: expressing a correlation coefficient to two or three significant figures)
Active recall beats re-reading. Take an instant quiz now to test what you’ve learned and lock it into long-term memory.
A week of Premium from your first lesson · Then the free plan continues · No card, no charge