OCR · A-Level · Psychology
Course version: H567 · Version from Sept 2015
Find arithmetic means (to include: calculating the means for two…
Full specification wording
D.1 – handling data: Find arithmetic means (to include: calculating the means for two conditions using raw data from a class experiment)
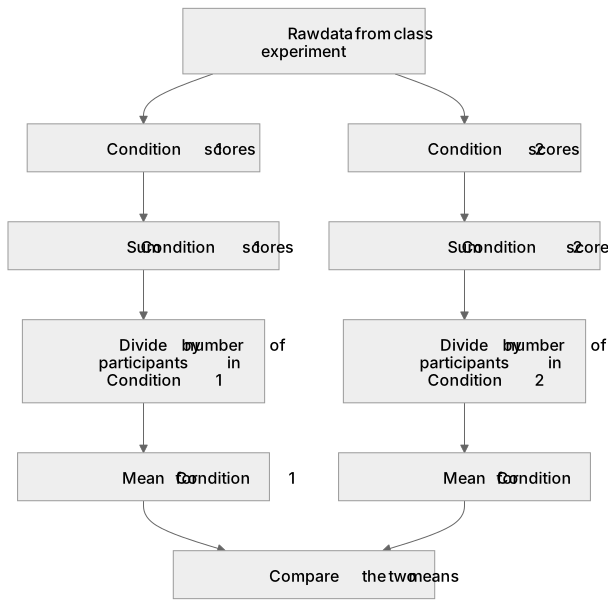
The arithmetic mean is the sum of all scores divided by the number of scores.
- Point 2 of 17
- 3 key terms
Study notes
From the teaching notes for this specification point.
The idea
The arithmetic mean is the sum of all scores divided by the number of scores. In a two-condition class experiment, means are calculated separately for each condition using raw data to allow comparison. The mean is suitable for interval data because it uses every value. However, this makes it sensitive to extreme scores; one participant scoring unusually low will drag the mean down, making the median a safer summary if outliers exist. For example, Loftus and Palmer (1974) reported mean speed estimates of 40.8 mph for the verb 'smashed' and 31.8 mph for 'contacted'. Report a mean to one more decimal place than the raw scores and pair it with a measure of dispersion.
What earns the marks
- Calculate the mean by dividing the sum of raw data scores in a single condition by the number of participants in that specific condition.
- Keep the calculations for two conditions strictly separate when analysing data from a class experiment to enable valid comparisons.
- Justify using the mean by stating the data is at the interval level and lacks extreme outliers, allowing all scores to contribute meaningfully.
- Present both condition means in the same units and to the same precision, ideally alongside a measure of dispersion such as standard deviation.
Common mistakes and how to put them right
Adding the totals of both conditions and dividing by the total number of participants, producing a single grand mean instead of two condition means.
Including a withdrawn participant's data in the total sum but omitting them from the divisor (or vice versa), skewing the calculated mean.
Claiming a difference between two means is statistically significant just because the values differ, ignoring the need for an inferential statistical test.
Exam tips
- Always show your working (the sum and the divisor) when calculating a mean from raw data, as method marks can be awarded even if the final division is incorrect.
- When asked to compare two conditions, explicitly state both calculated means and the direction of the difference rather than just saying one is higher.
Try the lesson
The start of the D.1 – handling data: Find arithmetic means (to include: calculating the means for two conditions using raw data from a class experiment) lesson, made from teaching notes for this specification point.
Have a go first
A psychology student conducts a class experiment measuring the number of words recalled by five participants. The raw data collected is 8, 12, 14, 19, and 22. What is the arithmetic mean for this condition?
Listen
The arithmetic mean is the sum of all scores divided by the number of scores. In a two-condition class experiment, means are calculated separately for each condition using raw data to allow comparison. The mean is suitable for interval data because it uses every value. However, this makes it sensitive to extreme scores; one participant scoring unusually low will drag the mean down, making the median a safer summary if outliers exist. For example, Loftus and Palmer (1974) reported mean speed estimates of 40.8 mph for the verb 'smashed' and 31.8 mph for 'contacted'. Report a mean to one more decimal place than the raw scores and pair it with a measure of dispersion. A strong answer earns marks for these points. Calculate the mean by dividing the sum of raw data scores in a single condition by the number of participants in that specific condition. Keep the calculations for two conditions strictly separate when analysing data from a class experiment to enable valid comparisons. Justify using the mean by stating the data is at the interval level and lacks extreme outliers, allowing all scores to contribute meaningfully. Present both condition means in the same units and to the same precision, ideally alongside a measure of dispersion such as standard deviation. Exam tip: Always show your working (the sum and the divisor) when calculating a mean from raw data, as method marks can be awarded even if the final division is incorrect.
See it
Key words
Say what each word means before you turn the card.
measures of central tendency
Try answering aloud or in your head before turning the card.
interval level data
Try answering aloud or in your head before turning the card.
comparing two conditions
Try answering aloud or in your head before turning the card.
See every definition
- measures of central tendency
- The arithmetic mean is one of these, found by dividing the sum of all scores by the number of scores.
- interval level data
- Data for which the mean is suitable because it uses every value.
- comparing two conditions
- Calculating means separately for each condition using raw data to allow comparison, keeping the calculations strictly separate.
Label the diagram
Some boxes have lost their names. Pick the right name for each number.
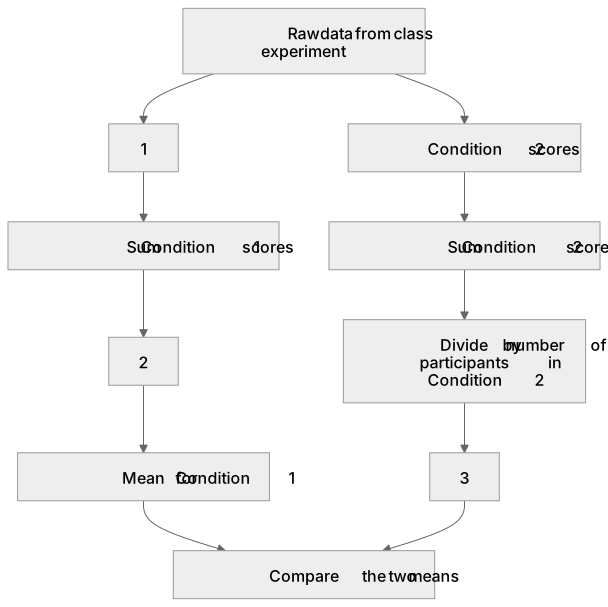
1Box 1
2Box 2
3Box 3
There is more to this lesson
The full lesson goes on to check your understanding and help you earn the marks. Create a free account to carry on, with your progress saved.
A week of Premium from your first lesson · Then the free plan continues · No card, no charge
Test your understanding of D.1 – handling data: Find arithmetic means (to include: calculating the means for two conditions using raw data from a class experiment)
Active recall beats re-reading. Take an instant quiz now to test what you’ve learned and lock it into long-term memory.
A week of Premium from your first lesson · Then the free plan continues · No card, no charge