OCR · A-Level · Psychology
Course version: H567 · Version from Sept 2015
Correlation: obtaining data for correlational analysis; positive…
Full specification wording
Research methods and techniques: Correlation: obtaining data for correlational analysis; positive correlation; negative correlation; no correlation.
Here the researcher measures two things that already vary and asks how they vary together, manipulating nothing, which is exactly why no causal claim can follow.
- Point 5 of 5
- 4 key terms
Study notes
From the teaching notes for this specification point.
The idea
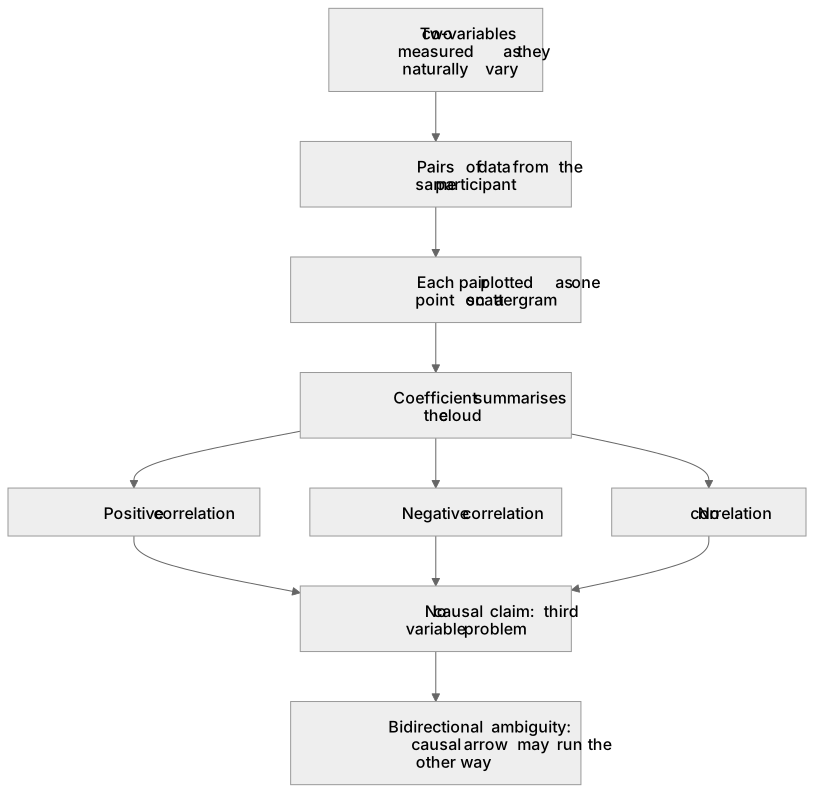
Here the researcher measures two things that already vary and asks how they vary together, manipulating nothing, which is exactly why no causal claim can follow. The data must be pairs taken from the same participant, each pair plotted as one point on a scattergram, and the coefficient that summarises the cloud runs from minus one through zero to plus one. Maguire et al. (2000) is the example worth carrying: the longer London taxi drivers had spent doing the job, the greater the grey matter volume in the posterior hippocampus and the smaller it was in the anterior region, so one study holds a relationship in each direction. Neither shows that driving changed the brain, since people with a larger posterior hippocampus may simply last longer in the work, and setting out that alternative is the evaluation examiners reward.
What earns the marks
- State the direction using the two variables themselves, as in the more hours slept the fewer errors made, rather than announcing that a negative correlation was found.
- A scattergram needs both co-variables labelled on the axes, one point per participant, and no line drawn through the points.
- Strength and direction are separate judgements: a coefficient close to zero means almost no relationship, while a coefficient of 0.8 is strong whether its sign is positive or negative.
- The third variable problem and the possibility that the causal arrow runs the other way are the two criticisms that reliably earn evaluation marks.
Common mistakes and how to put them right
Writing that the study proves one variable causes the other, or sliding into causal verbs such as affects, leads to and produces while describing a correlation.
Reading a negative correlation as no relationship or as a weak one, when the sign gives direction and only the size gives strength.
Drawing a bar chart for correlational data, or joining up the points on a scattergram as though it were a line graph.
Taking a significant result in a very large sample as proof of a large effect.
Exam tips
- Correlations turn up in the data handling questions, so be ready to sketch a labelled scattergram, describe what it shows in one sentence, and name the test you would run.
- Spearman's rho is the test to name for ranked or ordinal co-variables, and you then calculate the value and compare it with the critical value for the number of pairs at the five per cent level, one tailed only if direction was predicted.
- A common four mark item gives you a coefficient and asks what it tells the researcher, so answer with direction, then strength, then the warning about causation.
Try the lesson
The start of the Research methods and techniques: Correlation: obtaining data for correlational analysis; positive correlation; negative correlation; no correlation. lesson, made from teaching notes for this specification point.
Have a go first
A researcher investigates the relationship between the number of hours students spend playing video games and their scores on a memory test. The data shows that as video game hours increase, memory test scores decrease. Which type of relationship does this describe?
Listen
Here the researcher measures two things that already vary and asks how they vary together, manipulating nothing, which is exactly why no causal claim can follow. The data must be pairs taken from the same participant, each pair plotted as one point on a scattergram, and the coefficient that summarises the cloud runs from minus one through zero to plus one. Maguire et al. (2000) is the example worth carrying: the longer London taxi drivers had spent doing the job, the greater the grey matter volume in the posterior hippocampus and the smaller it was in the anterior region, so one study holds a relationship in each direction. Neither shows that driving changed the brain, since people with a larger posterior hippocampus may simply last longer in the work, and setting out that alternative is the evaluation examiners reward. A strong answer earns marks for these points. State the direction using the two variables themselves, as in the more hours slept the fewer errors made, rather than announcing that a negative correlation was found. A scattergram needs both co-variables labelled on the axes, one point per participant, and no line drawn through the points. Strength and direction are separate judgements: a coefficient close to zero means almost no relationship, while a coefficient of 0.8 is strong whether its sign is positive or negative. The third variable problem and the possibility that the causal arrow runs the other way are the two criticisms that reliably earn evaluation marks. Exam tip: Correlations turn up in the data handling questions, so be ready to sketch a labelled scattergram, describe what it shows in one sentence, and name the test you would run.
See it
Key words
Say what each word means before you turn the card.
co-variables
Try answering aloud or in your head before turning the card.
scattergrams
Try answering aloud or in your head before turning the card.
direction and strength
Try answering aloud or in your head before turning the card.
third variable problem
Try answering aloud or in your head before turning the card.
See every definition
- co-variables
- Two things that already vary and are measured by the researcher, who asks how they vary together while manipulating nothing.
- scattergrams
- A plot with both co-variables labelled on the axes and one point per participant, with no line drawn through the points.
- direction and strength
- Separate judgements, where the sign gives direction and only the size gives strength, so a coefficient close to zero means almost no relationship.
- third variable problem
- One of the two criticisms that reliably earn evaluation marks, alongside the possibility that the causal arrow runs the other way.
Label the diagram
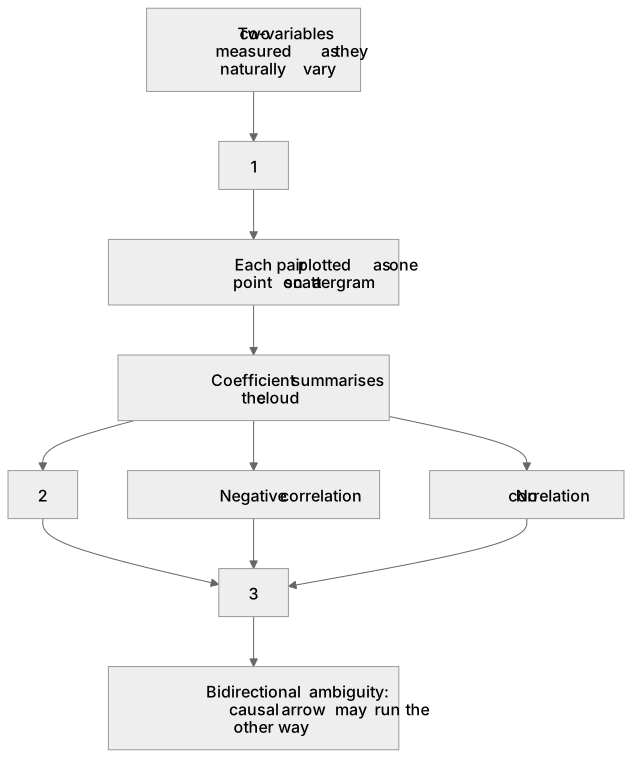
Some boxes have lost their names. Pick the right name for each number.
1Box 1
2Box 2
3Box 3
There is more to this lesson
The full lesson goes on to check your understanding and help you earn the marks. Create a free account to carry on, with your progress saved.
A week of Premium from your first lesson · Then the free plan continues · No card, no charge
Test your understanding of Research methods and techniques: Correlation: obtaining data for correlational analysis; positive correlation; negative correlation; no correlation.
Active recall beats re-reading. Take an instant quiz now to test what you’ve learned and lock it into long-term memory.
A week of Premium from your first lesson · Then the free plan continues · No card, no charge