Probability — Eduqas GCSE Mathematics
This course is being built. Notes are AI-generated until checked.
Test yourself on Probability with EDUQAS GCSE practice questions.
A week of Premium from your first lesson · Then the free plan continues · No card, no charge
Probability explained
The Number topic covers the fundamental arithmetic and structural properties of mathematics, including integers, decimals, fractions, and negative numbers.
Read the full explanation
It extends to advanced concepts such as prime factorisation, standard form, surds, and limits of accuracy, providing the essential foundation for all other mathematical areas.
Watch and listen
Listen: Probability audio lesson
Read the full guide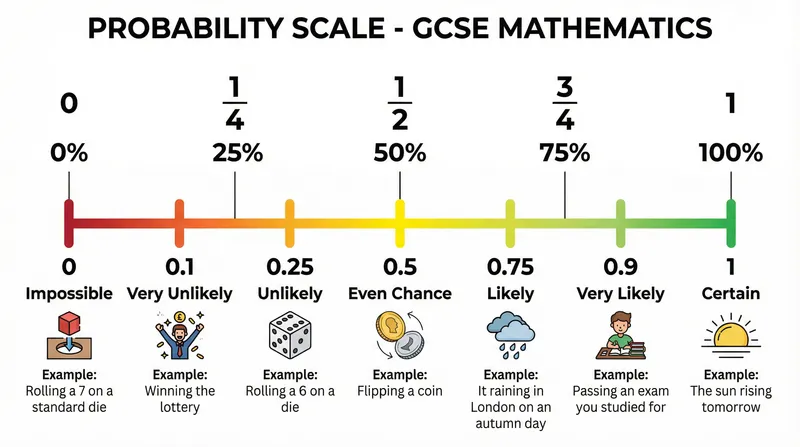
Interactive Diagrams
1 interactive diagram to visualise key concepts
Conceptual Flow Outline
The difference between Theoretical and Experimental Probability
What to demonstrate
- Correct application of the order of operations (BIDMAS/BODMAS).
- Accurate use of formal written methods for the four operations.
- Correct identification and use of prime factors, HCF, and LCM.
Show all 6 objectives
- Precise rounding to specified decimal places or significant figures.
- Correct manipulation of standard form and surds.
- Accurate calculation of upper and lower bounds in limits of accuracy problems.
Probability exam tips
Topic Overview
Probability is the branch of mathematics that quantifies the likelihood of events occurring. In the WJEC GCSE Mathematics curriculum, it is a key topic within the 'Statistics and Probability' strand. You will learn to calculate probabilities using theoretical models, experimental data, and sample space diagrams. Understanding probability is essential not only for exams but also for making informed decisions in everyday life, such as assessing risk or interpreting weather forecasts.
The topic builds on basic arithmetic and fractions, and it connects to other areas like data handling and algebra. You will explore concepts such as mutually exclusive events, independent events, and conditional probability. Mastery of probability requires a logical approach and careful interpretation of problem statements. The skills you develop here will also support your understanding of more advanced topics like probability distributions if you continue to A-level Mathematics.
In the WJEC exam, probability questions often appear in both non-calculator and calculator papers. They range from simple one-step calculations to multi-step problems involving tree diagrams or Venn diagrams. A solid grasp of probability can significantly boost your overall grade, as it is a topic where clear, methodical working is rewarded. By the end of this unit, you should be able to calculate probabilities confidently and communicate your reasoning effectively.
Key Concepts
- →The probability scale: probabilities range from 0 (impossible) to 1 (certain), and can be expressed as fractions, decimals, or percentages.
- →Theoretical probability: for equally likely outcomes, P(event) = (number of favourable outcomes) / (total number of possible outcomes).
- →Relative frequency: experimental probability calculated from data, which can be used to estimate theoretical probability and is given by (frequency of event) / (total frequency).
- →Tree diagrams and Venn diagrams: tools for visualising and calculating probabilities of combined events, including 'and' (multiply) and 'or' (add) rules.
- →Mutually exclusive events: events that cannot happen at the same time, so P(A or B) = P(A) + P(B). Independent events: events where one does not affect the other, so P(A and B) = P(A) × P(B).
Marking Points
- Correct application of the order of operations (BIDMAS/BODMAS).
- Accurate use of formal written methods for the four operations.
- Correct identification and use of prime factors, HCF, and LCM.
- Precise rounding to specified decimal places or significant figures.
- Correct manipulation of standard form and surds.
- Accurate calculation of upper and lower bounds in limits of accuracy problems.
Examiner Tips
- 💡Always show working out, as method marks are awarded even if the final answer is incorrect.
- 💡Check if the question requires an exact answer (e.g., in terms of pi or surds) or a rounded decimal.
- 💡Use estimation to check the reasonableness of your calculated answers.
- 💡For non-calculator papers, practice mental arithmetic and formal written methods regularly.
- 💡Read the question carefully to identify if it asks for significant figures or decimal places.
- 💡Always show your working clearly, especially when using tree diagrams or Venn diagrams. Marks are often awarded for method, even if your final answer is incorrect. Write probabilities as fractions in their simplest form unless the question specifies otherwise.
- 💡Read the question carefully to determine whether events are independent or mutually exclusive. Look for key phrases like 'with replacement' (independent) or 'without replacement' (dependent). Misinterpreting this is a common source of error.
- 💡When using a tree diagram, label each branch with the probability and check that the probabilities on branches from the same point sum to 1. For 'at least one' type questions, consider using the complement: P(at least one) = 1 - P(none).
Common Mistakes
- Incorrect handling of negative numbers during addition, subtraction, or multiplication.
- Failure to follow the correct order of operations.
- Misinterpreting place value when working with very large or very small numbers.
- Rounding prematurely during multi-step calculations, leading to inaccurate final answers.
- Confusing the rules for upper and lower bounds.
- Misconception: 'If I toss a coin and get heads five times in a row, tails is more likely next time.' Correction: Coin tosses are independent; the probability of tails remains 1/2 each time, regardless of previous outcomes.
- Misconception: 'Adding probabilities always gives the probability of either event.' Correction: This only works for mutually exclusive events. For non-mutually exclusive events, you must subtract the overlap: P(A or B) = P(A) + P(B) - P(A and B).
- Misconception: 'Multiplying probabilities always gives the probability of both events.' Correction: This only works for independent events. For dependent events, you need to use conditional probability: P(A and B) = P(A) × P(B given A).