Pearson Edexcel · GCSE · Geography
Geographical investigations − fieldwork: Investigating human environments (central/inner urban area OR rural settlements)
Master the Geographical Enquiry Process for human environments, covering both urban and rural fieldwork. This guide ensures you know exactly how to select, justify, and evaluate your data collection methods to secure top marks.
- 7 min read
- 3 worked examples
- 5 practice questions
- 6 key terms
Study Notes
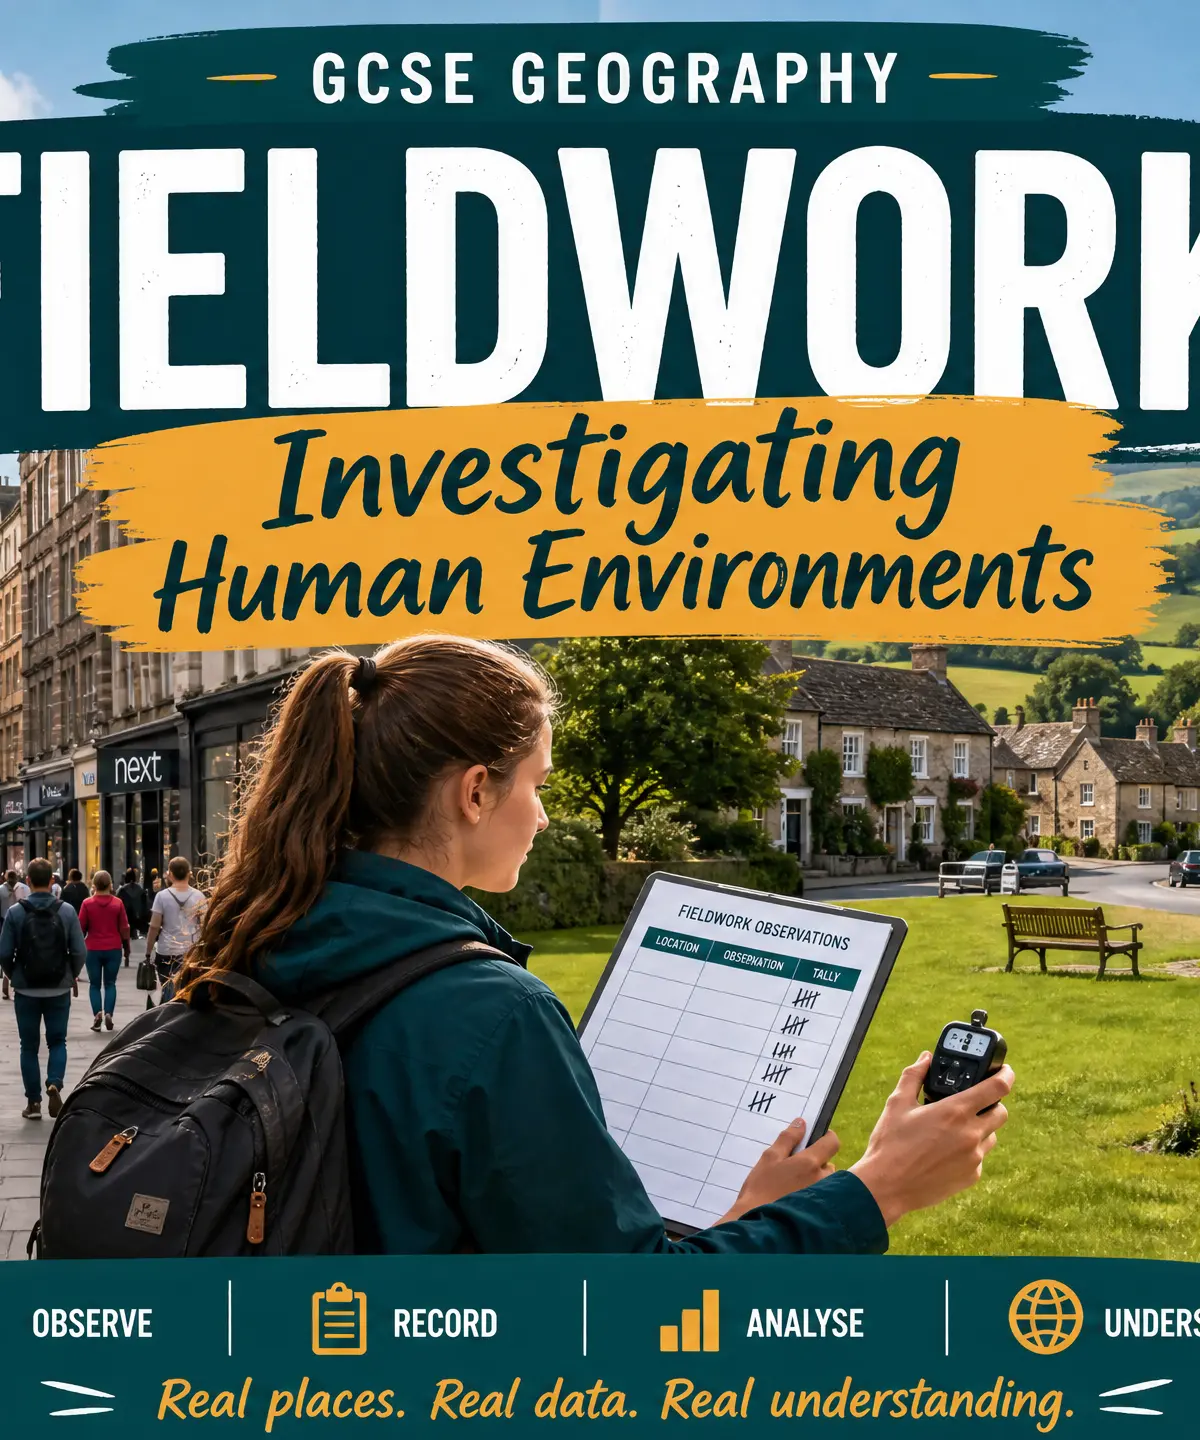
Overview
Geographical fieldwork is a core component of your GCSE Geography qualification. Examiners want to see that you can do more than just collect data; you must understand the entire Geographical Enquiry Cycle. This means formulating focused questions, selecting appropriate methods, presenting data clearly, analysing patterns, and critically evaluating your entire investigation. For human environments, you will have studied either a central/inner urban area or a rural settlement. A crucial element that candidates often miss is the requirement to investigate the interaction between physical landscape features and the human settlement. You must also demonstrate competence in using both qualitative and quantitative methods, as well as secondary data sources.
Listen to the companion podcast for an in-depth review of the topic:

The Geographical Enquiry Cycle
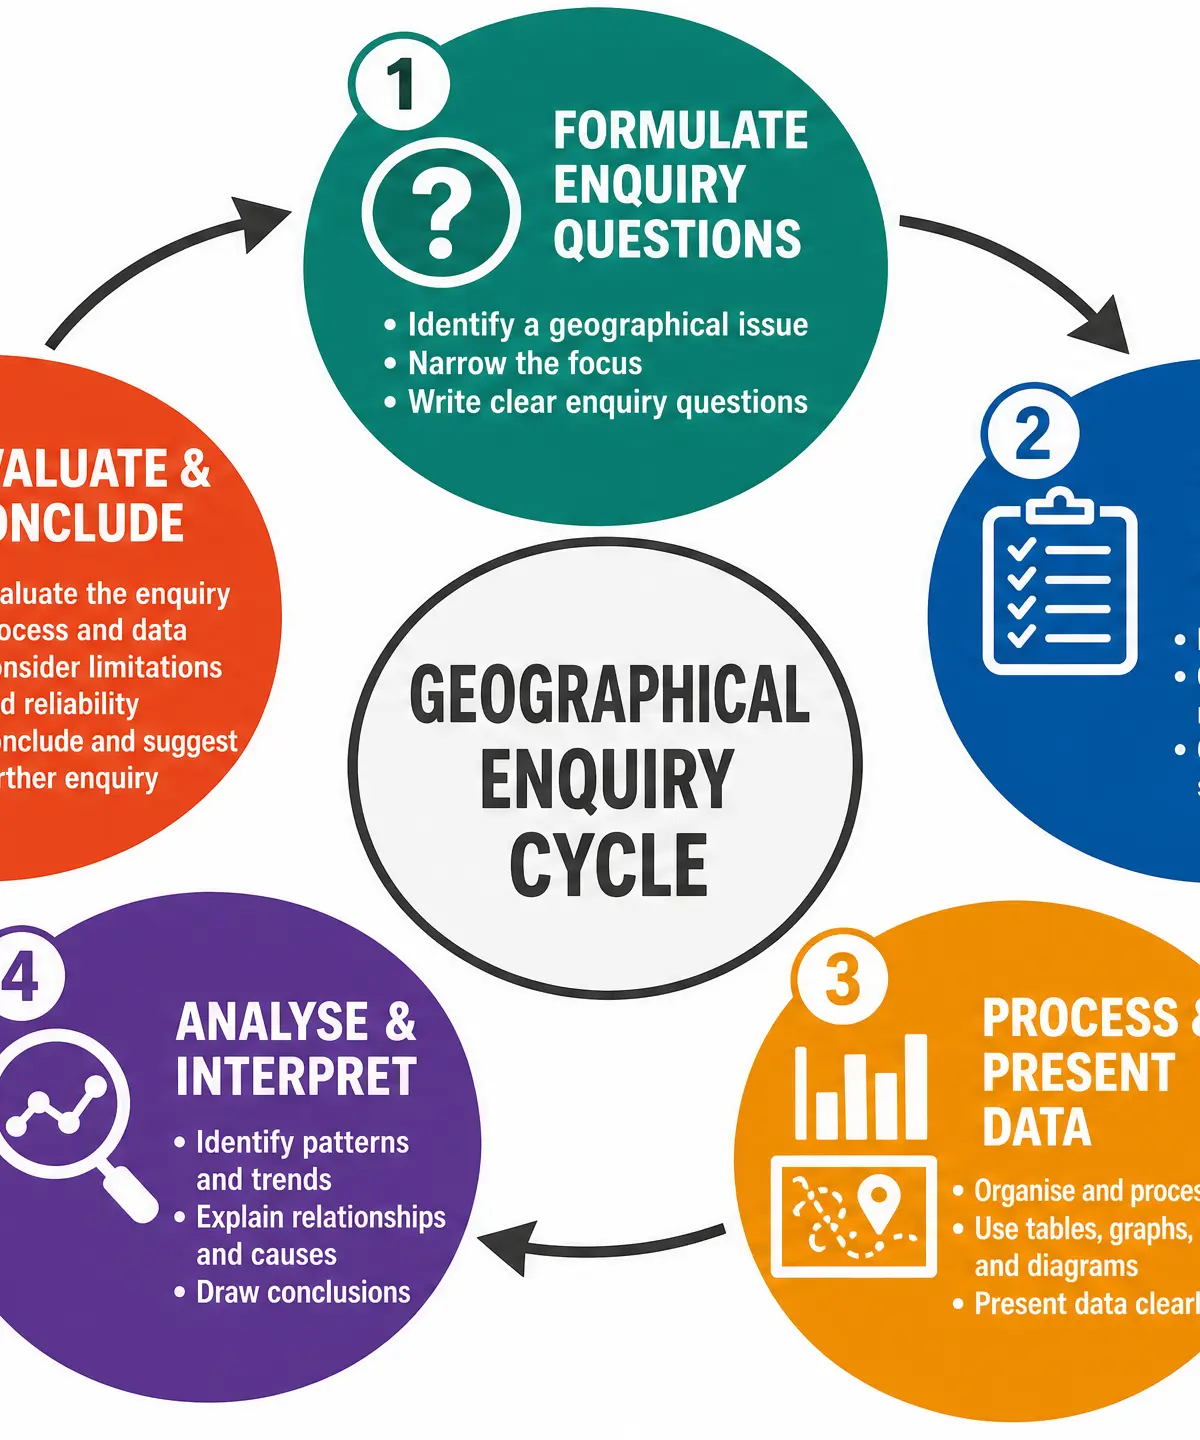
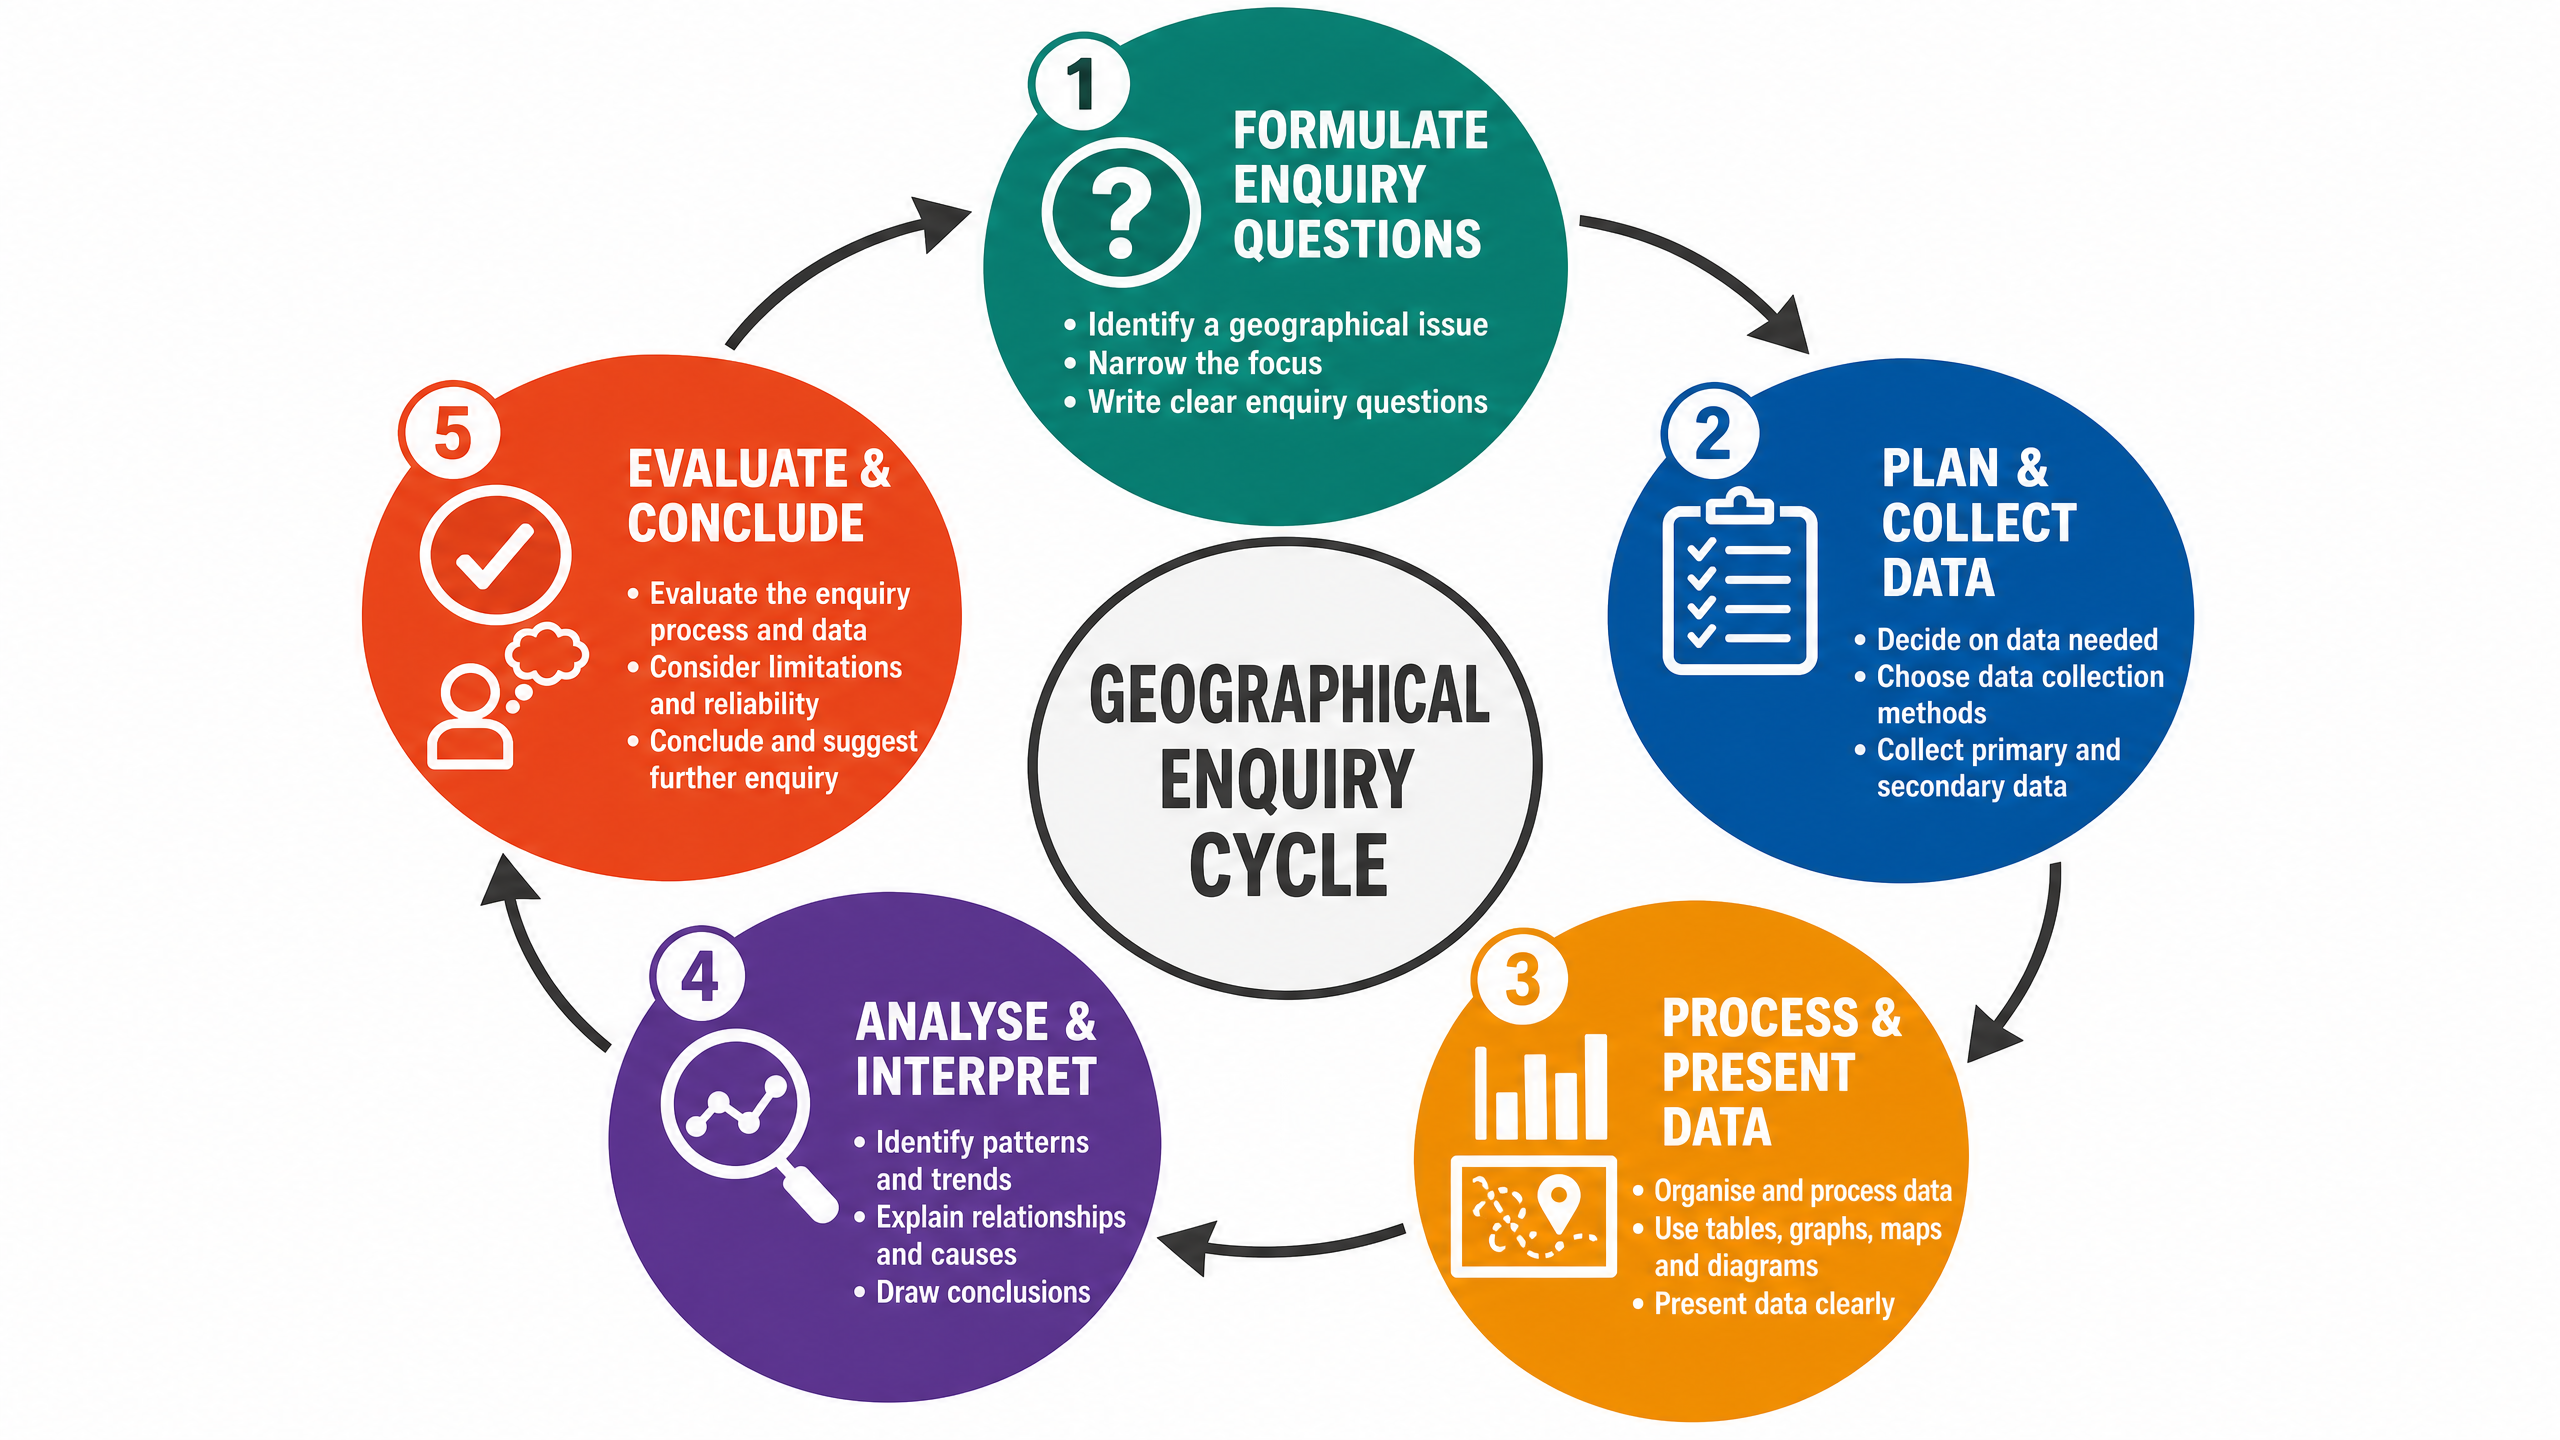
The fieldwork process follows a logical sequence. Examiners expect you to understand how each stage connects to the others.
1. Formulate Enquiry Questions
What it is: Identifying a geographical issue and defining specific, measurable questions or hypotheses.
Why it matters: A vague question leads to vague data. Your questions must be tightly focused on a specific location and geographical concept (e.g., deprivation, counter-urbanisation, or retail change).
Specific Knowledge: Ensure your questions allow for both primary data collection and the use of secondary sources.
2. Plan and Collect Data
What it is: Selecting appropriate methods and gathering information in the field.
Why it matters: You must be able to justify why you chose specific methods and sampling strategies (random, systematic, or stratified). You must use at least one qualitative and one quantitative method.
Specific Knowledge: Know the difference between primary data (collected yourself) and secondary data (existing data from other sources).
3. Process and Present Data
What it is: Organising raw data into a visual format that makes patterns clear.
Why it matters: Examiners assess your graphical skills. You need to know which presentation technique is most appropriate for your data type.
Specific Knowledge: Examples include proportional symbols, choropleth maps, scatter graphs, and dispersion graphs.
4. Analyse and Interpret
What it is: Describing the patterns in your presented data and explaining why they exist using geographical theory.
Why it matters: This is where you demonstrate your geographical understanding, linking your specific findings back to broader concepts.
Specific Knowledge: Use specific data points (numbers, percentages) to support your analysis.
5. Evaluate and Conclude
What it is: Drawing conclusions based on evidence and critically assessing the reliability and limitations of your methods.
Why it matters: This is often the highest-tariff section in the exam. You must show "sustained evaluation"—recognising that no fieldwork is perfect.
Specific Knowledge: Be prepared to suggest specific improvements to your methodology.
Fieldwork Methods
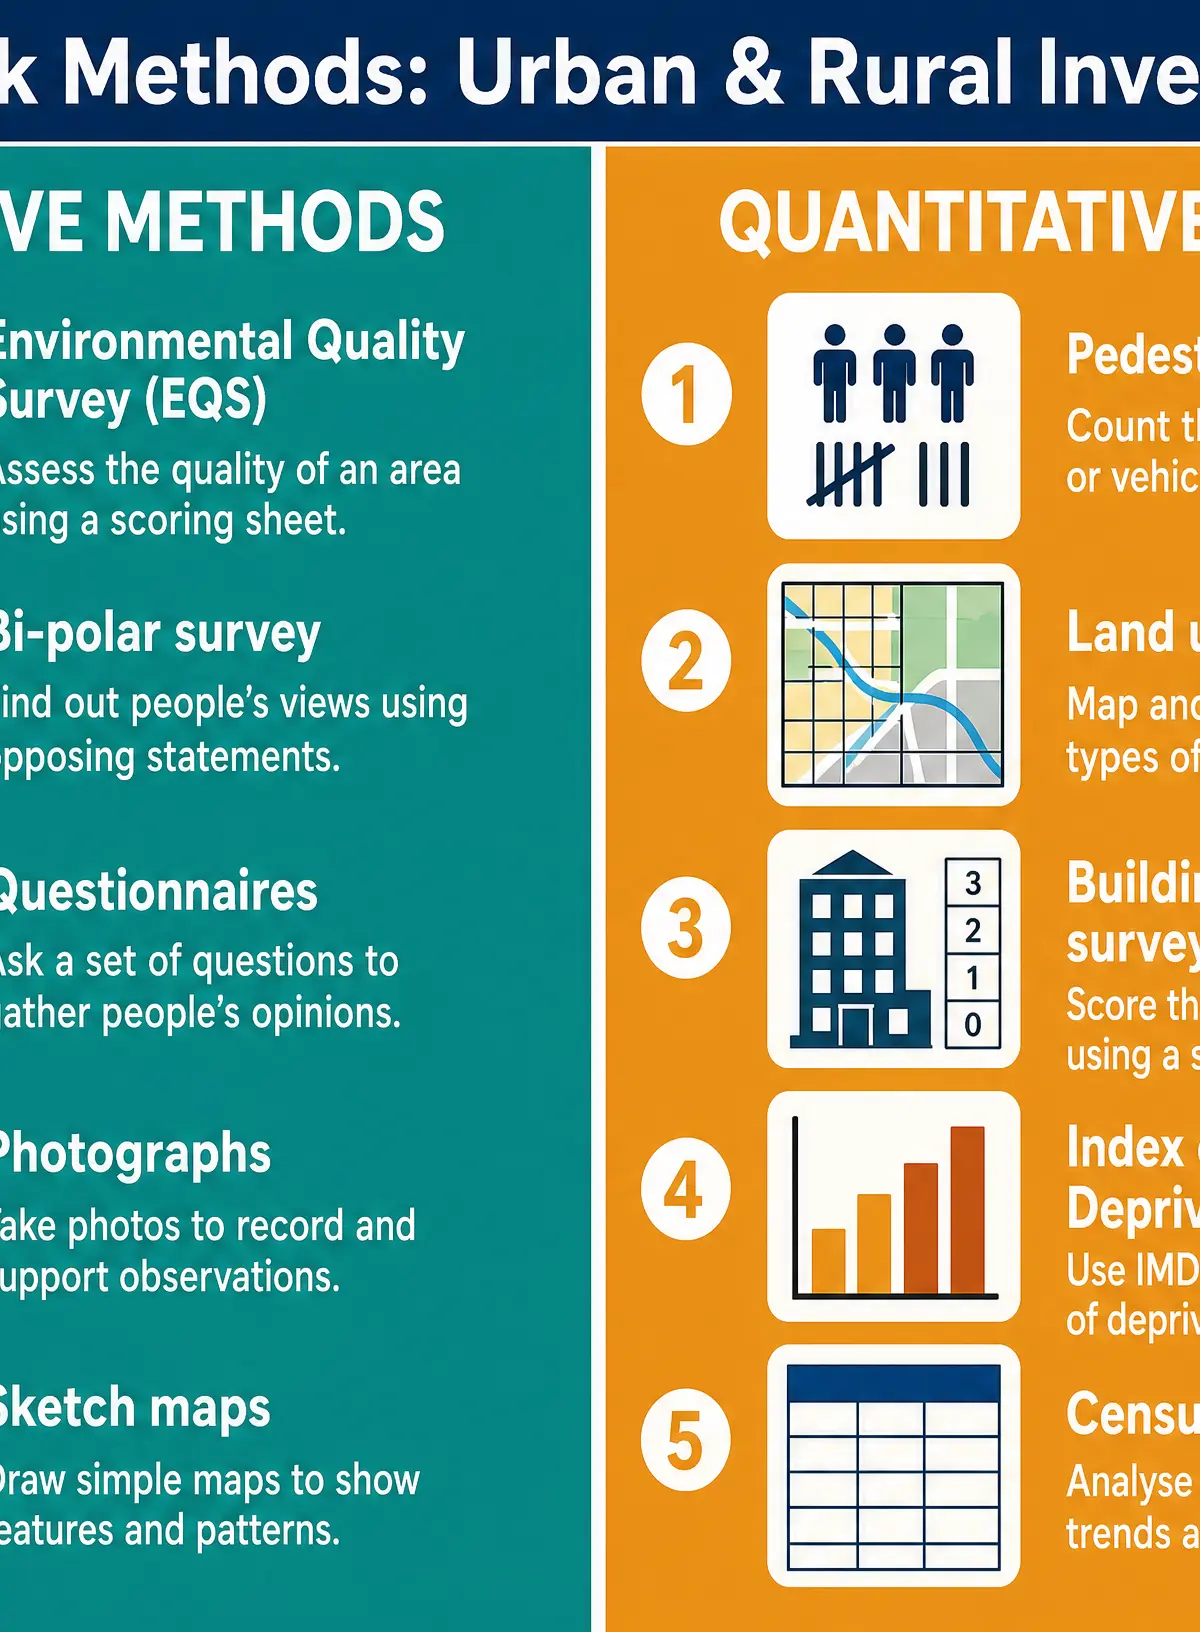
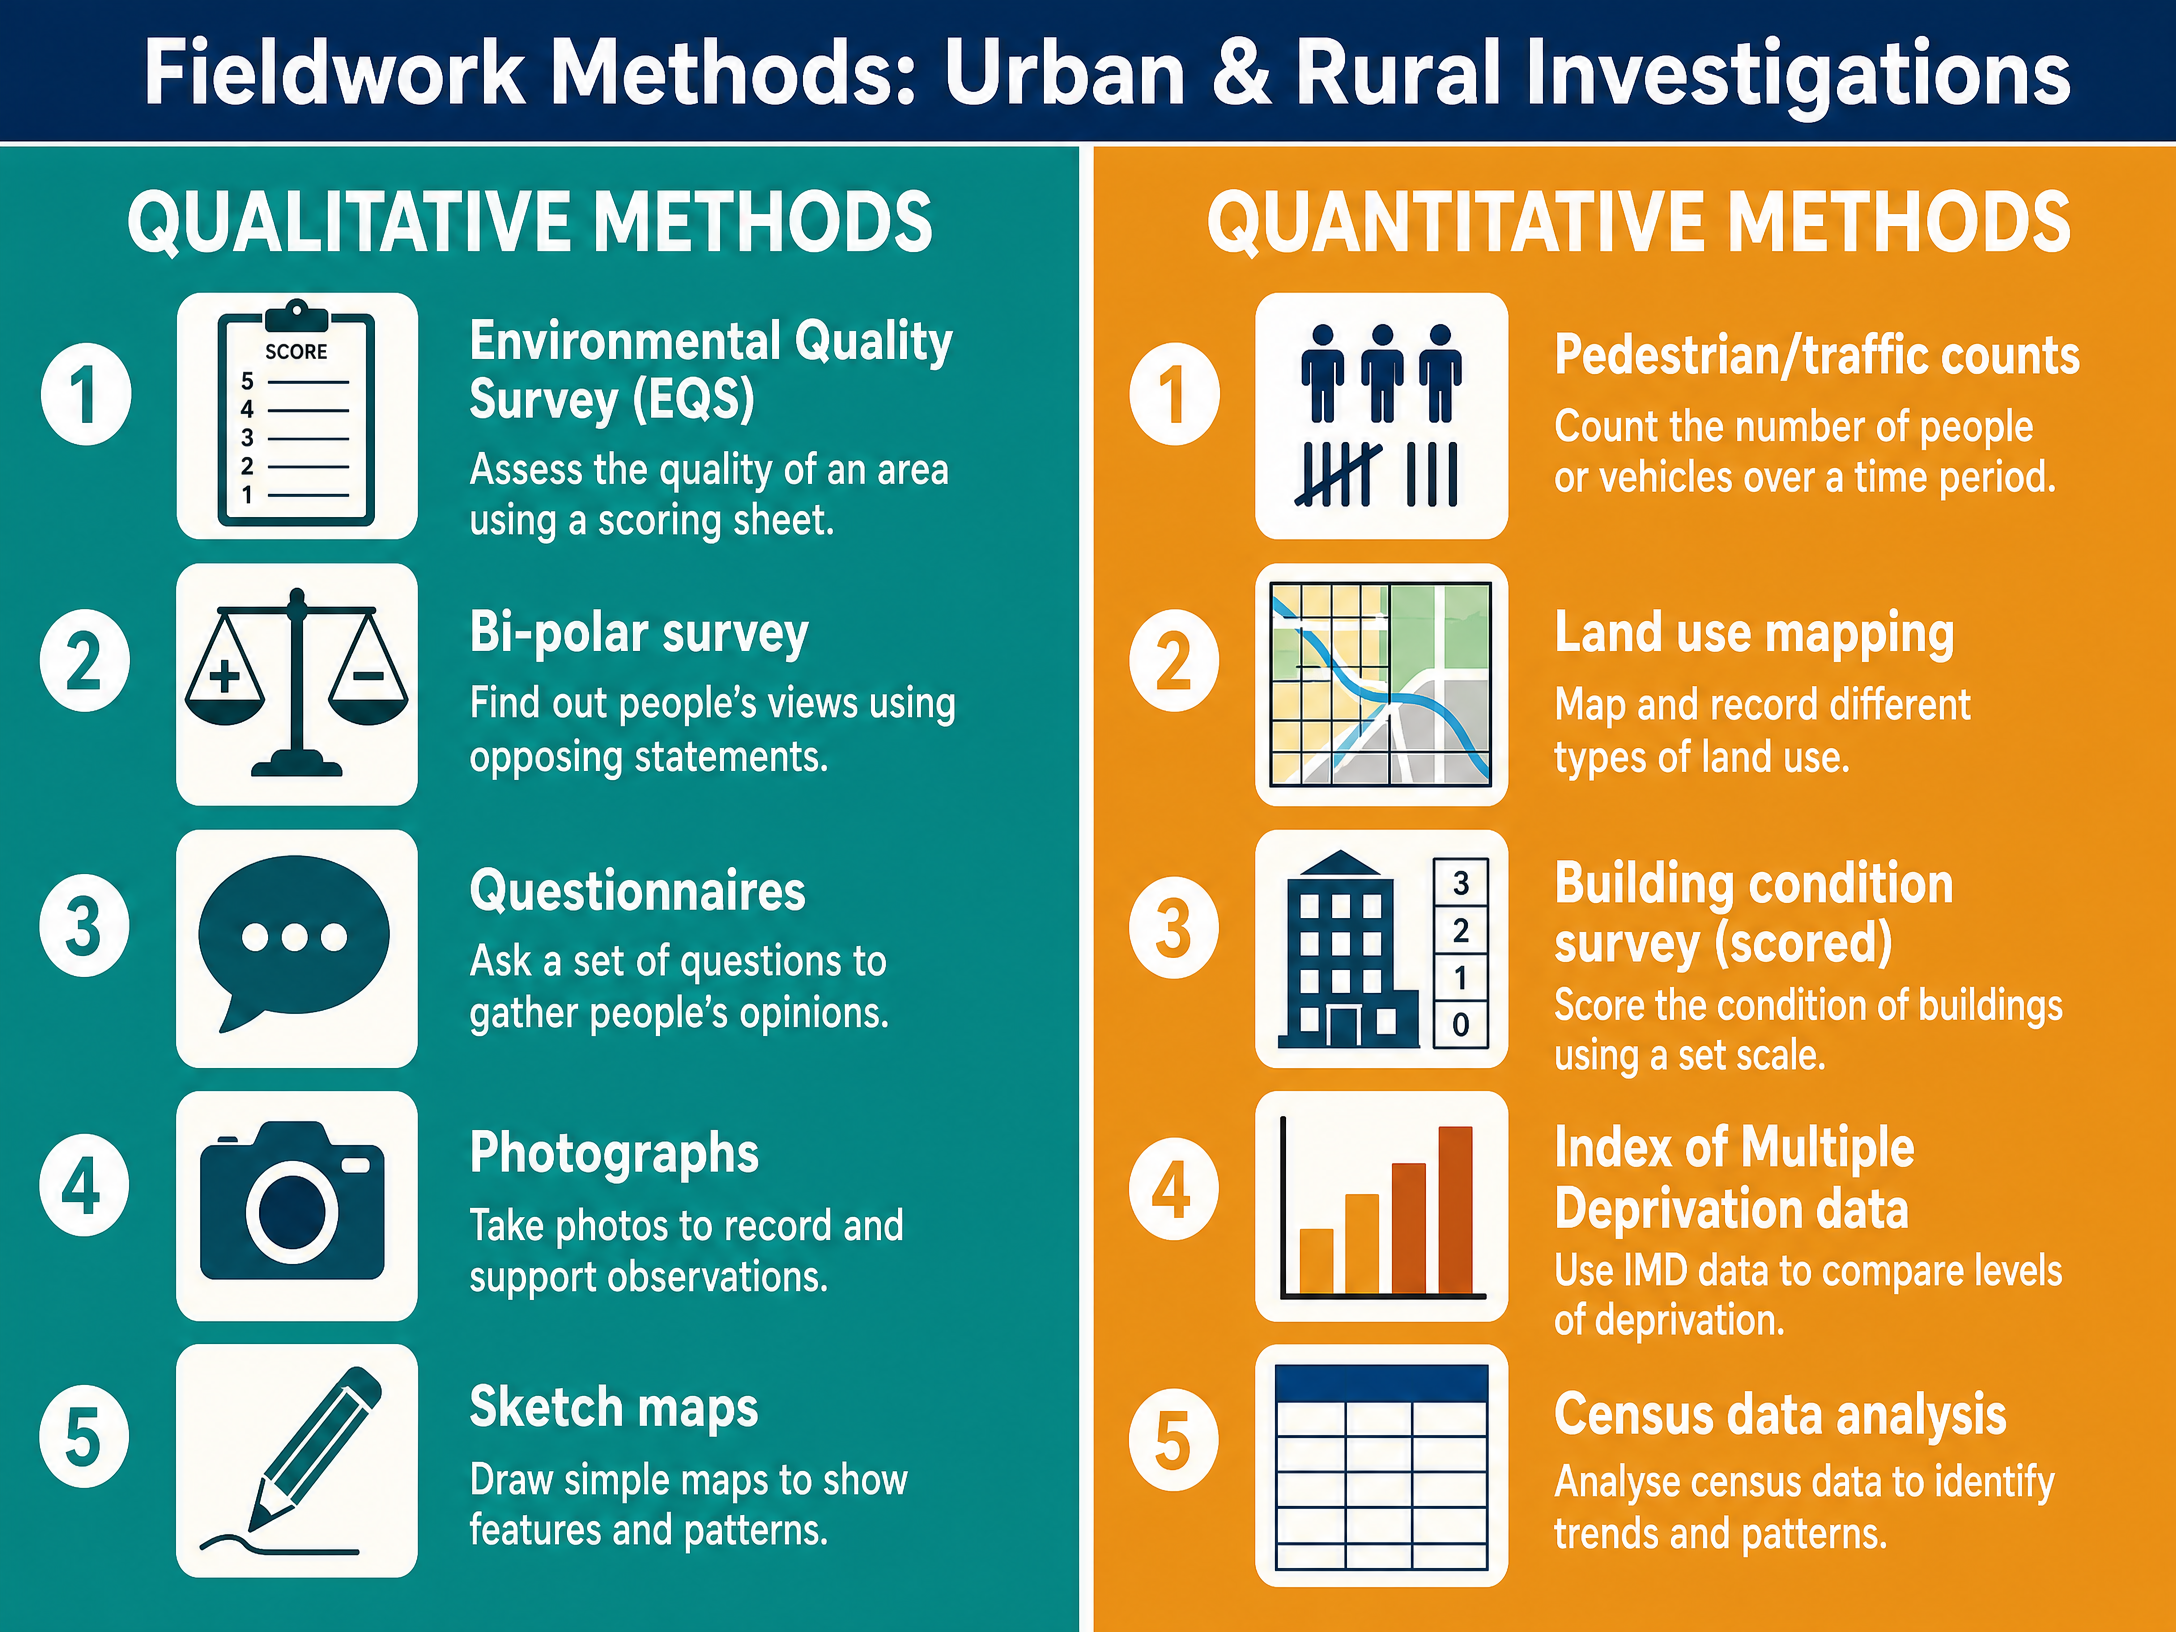
You must be confident in discussing both qualitative and quantitative methods. Examiners frequently ask candidates to justify their choice of methods.
Qualitative Methods
These methods record qualities, opinions, and perceptions. They are subjective but provide valuable context.
- Environmental Quality Survey (EQS): Scoring an area against a set of criteria (e.g., litter, noise, building maintenance). It helps quantify subjective observations but is prone to observer bias.
- Bi-polar Survey: Rating an area on a scale between two opposing adjectives (e.g., -3 for "noisy" to +3 for "quiet").
- Questionnaires: Asking the public for their views. Useful for understanding perceptions of change, but response rates can be low and answers may be biased.
- Annotated Photographs: Taking photos and adding descriptive labels to highlight specific geographical features or issues.
Quantitative Methods
These methods produce numerical data that can be statistically analysed and graphed. They are generally more objective.
- Pedestrian/Traffic Counts: Tallying the number of people or vehicles passing a point in a set time. Useful for assessing the busyness or function of an area.
- Land Use Mapping (GOAD): Recording the function of every ground-floor building along a transect (e.g., retail, residential, vacant). Often uses a standard classification system.
- Building Condition Survey: Using a strict numerical scale to rate the physical state of buildings, providing a quantitative measure of urban decay or regeneration.
Secondary Data Sources
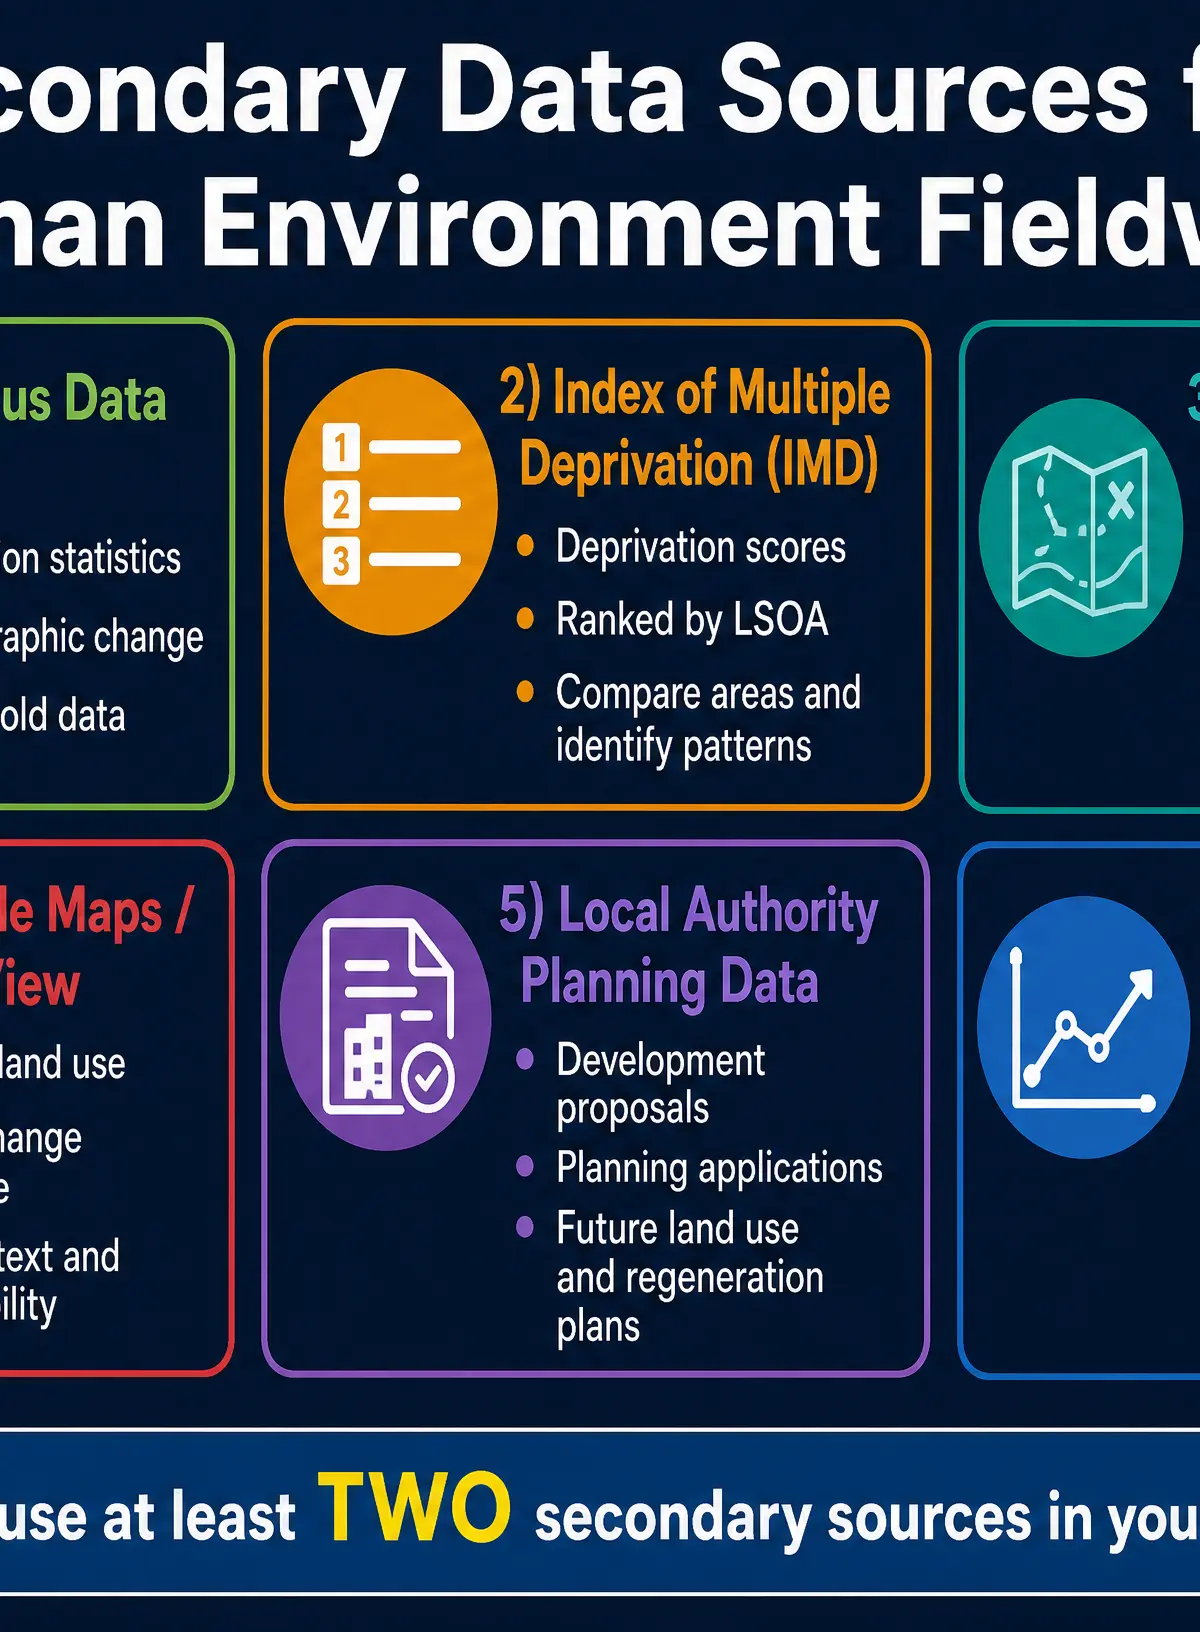
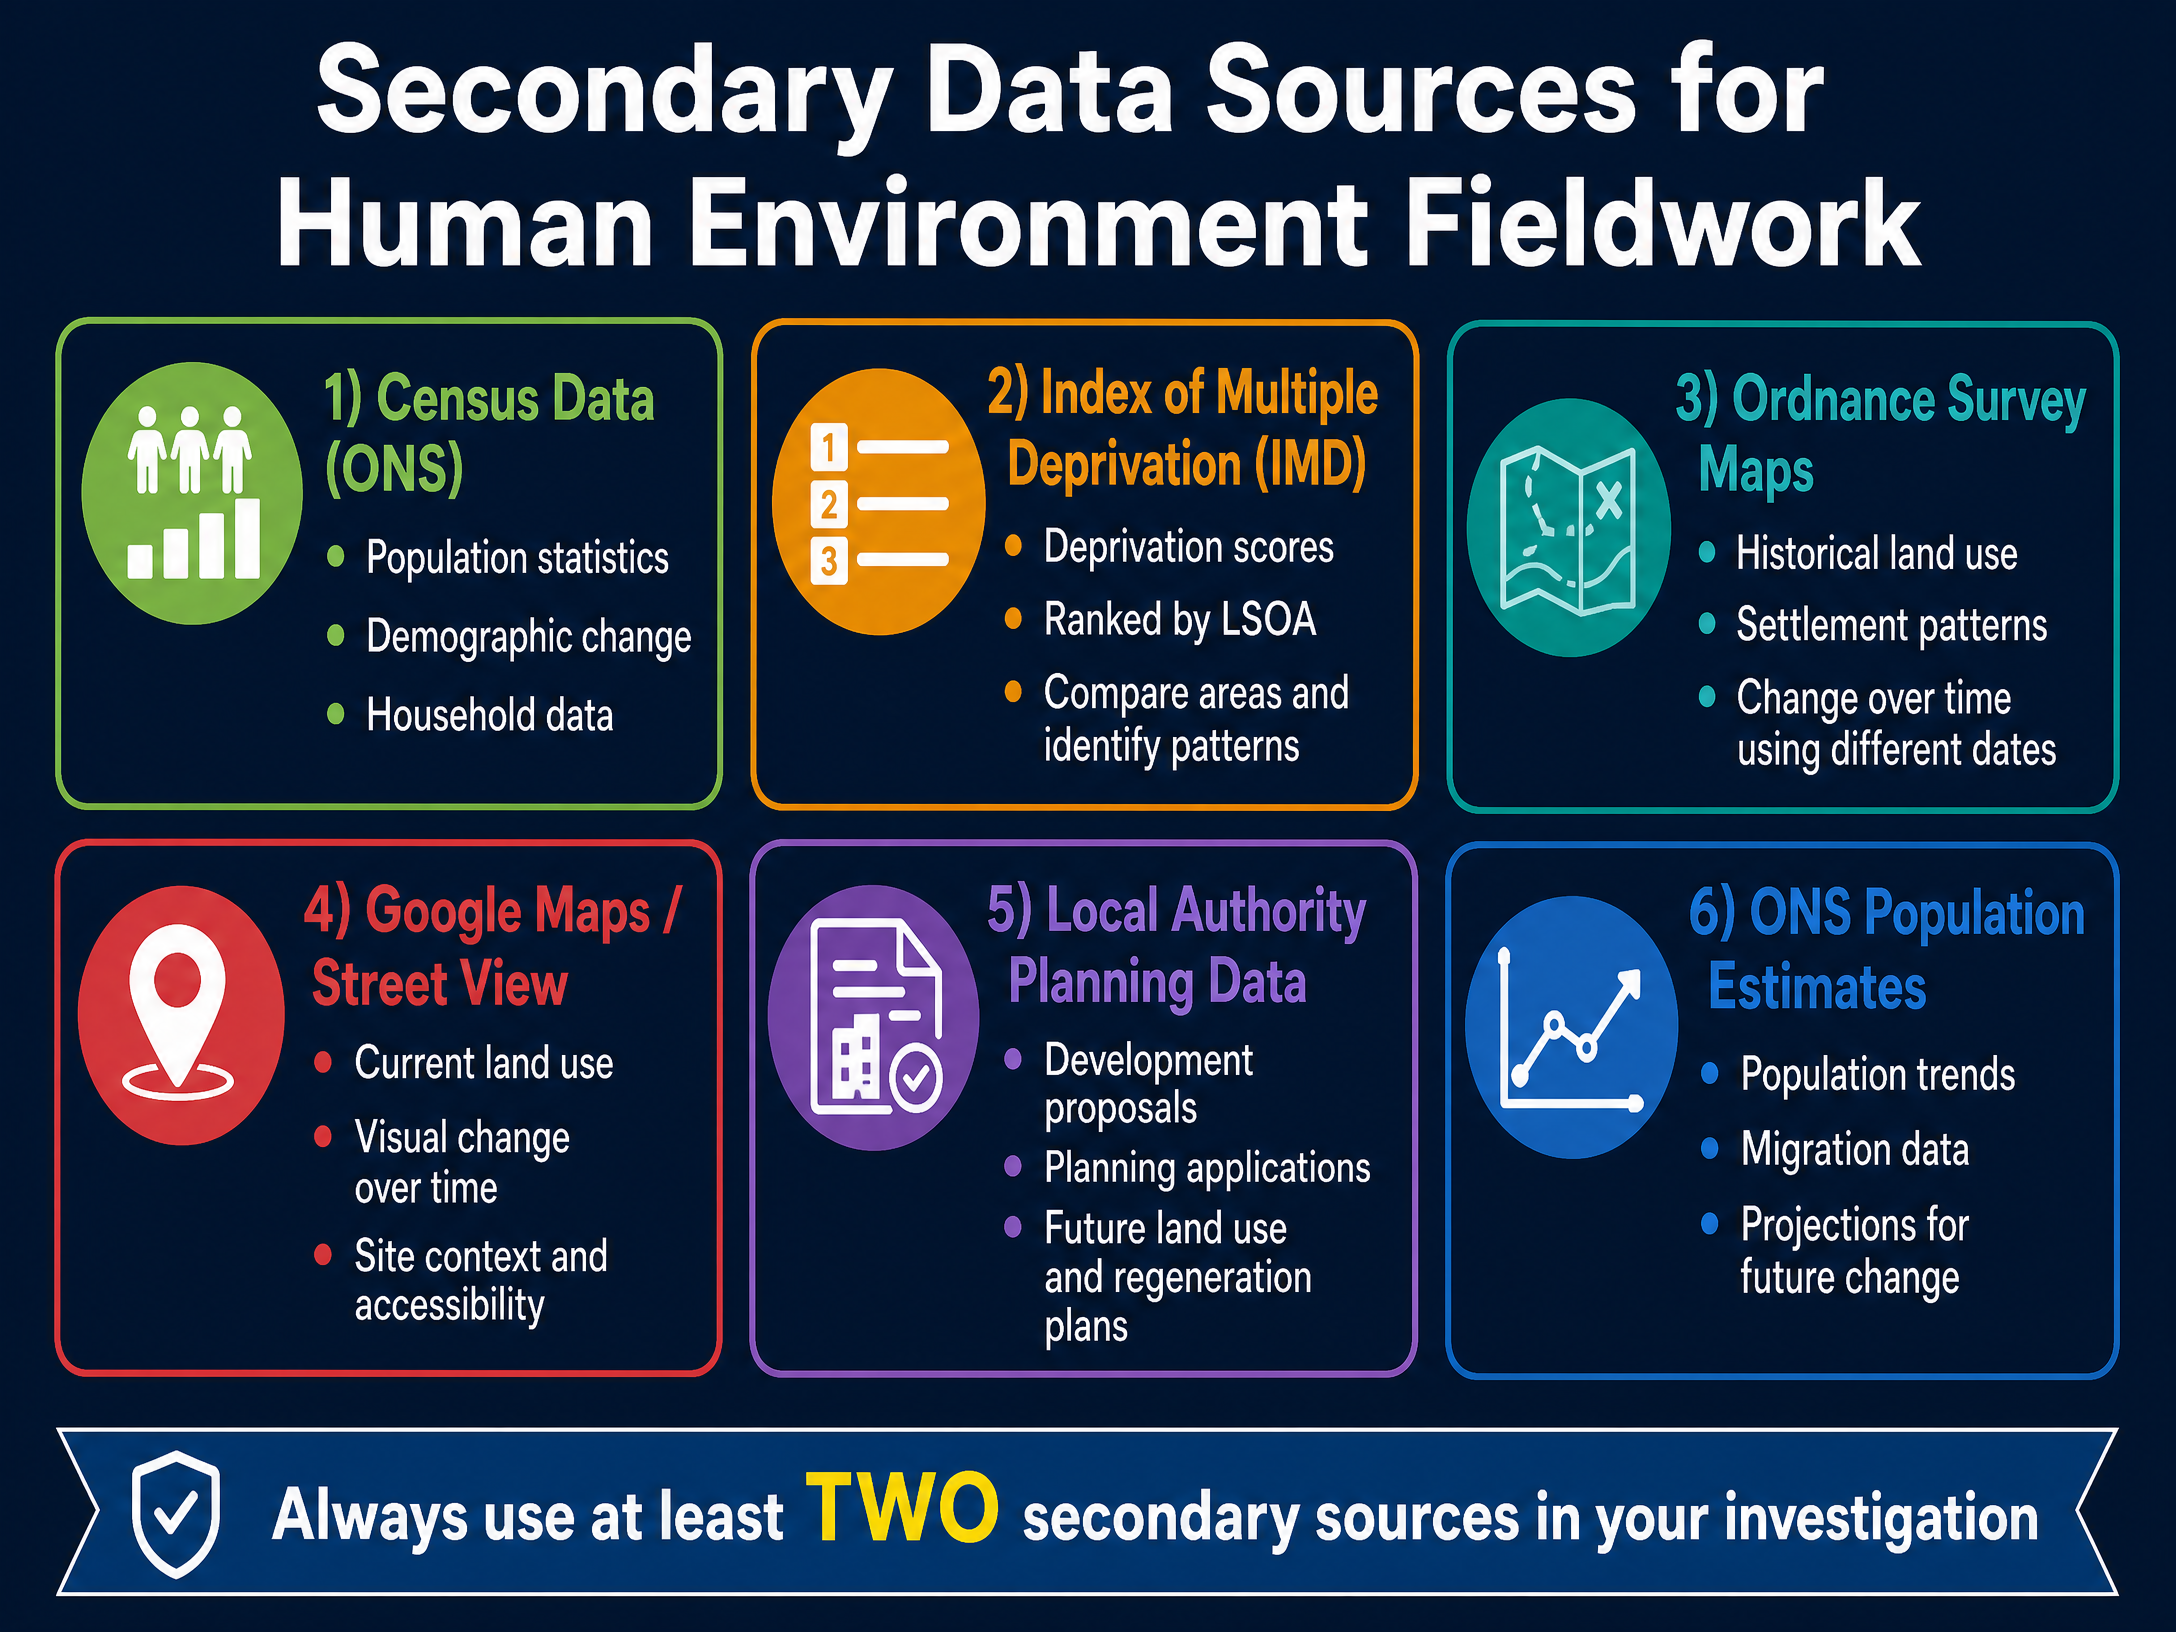
The specification mandates the use of at least two secondary data sources. You must be able to explain how they supported your primary data.
- Census Data (ONS): Provides detailed demographic information (age, ethnicity, employment) down to the Output Area level. Essential for understanding the socioeconomic character of a settlement.
- Index of Multiple Deprivation (IMD): Ranks areas based on seven domains of deprivation. Crucial for urban investigations looking at inequality or decline.
- Ordnance Survey (OS) Maps: Comparing historical and modern maps allows you to identify changes in settlement shape, size, and land use over time.
- Local Authority Planning Data: Provides information on proposed developments, regeneration schemes, and housing targets.
Physical and Human Interaction
A common pitfall is treating the human environment in isolation. Examiners specifically look for an understanding of how the physical landscape interacts with the settlement.
- Relief and Topography: How does the steepness of the land affect where housing or industry is built? (e.g., wealthy housing often on higher ground with views; industry on flat floodplains).
- Drainage and Rivers: Did the settlement develop at a bridging point or confluence? How does flood risk constrain modern development?
- Geology: Did the settlement develop at a spring line (where water emerges from permeable rock)? Was local stone used as a building material, giving the settlement a specific character?
Visual Resources
3 diagrams and illustrations
Interactive Diagrams
1 interactive diagram to visualise key concepts
Diagram could not be rendered
A pie chart is an effective way to present proportional quantitative data, such as land use categories.
Worked Examples
3 worked examples — open one to explore the question and available guidance.
Practice Questions
Test your understanding — click to reveal model answers
For a human geography enquiry you have undertaken, assess the effectiveness of your data presentation techniques. (6 marks)
Hint: Name specific graph types. Discuss why they were good, but also what their limitations were. Did they help you answer your enquiry question?
State one risk associated with your human geography fieldwork and explain how it was managed. (2 marks)
Hint: Identify a specific hazard, not a vague one. Explain the exact action taken to reduce the risk.
Explain why it was important to use both qualitative and quantitative methods in your investigation. (4 marks)
Hint: Define both types and explain how they complement each other.
To what extent did your conclusions support your original geographical hypothesis? (9 marks + 3 SPaG)
Hint: State your hypothesis clearly. Use specific data from your results to show where it was supported, and where it was not. Evaluate the strength of your evidence.
Identify one limitation of a secondary data source you used and explain how it affected your enquiry. (3 marks)
Hint: Think about when the data was collected or the scale it covers.