Pearson Edexcel · GCSE · Geography
Geographical investigations − fieldwork: Investigating physical environments (river landscapes OR coastal landscapes)
Master the GCSE Geography fieldwork investigation for physical environments. This guide breaks down the geographical enquiry cycle for river and coastal landscapes, showing you exactly how to collect, process, and evaluate data to secure top marks.
- 5 min read
- 3 worked examples
- 5 practice questions
- 6 key terms
Study Notes
Overview
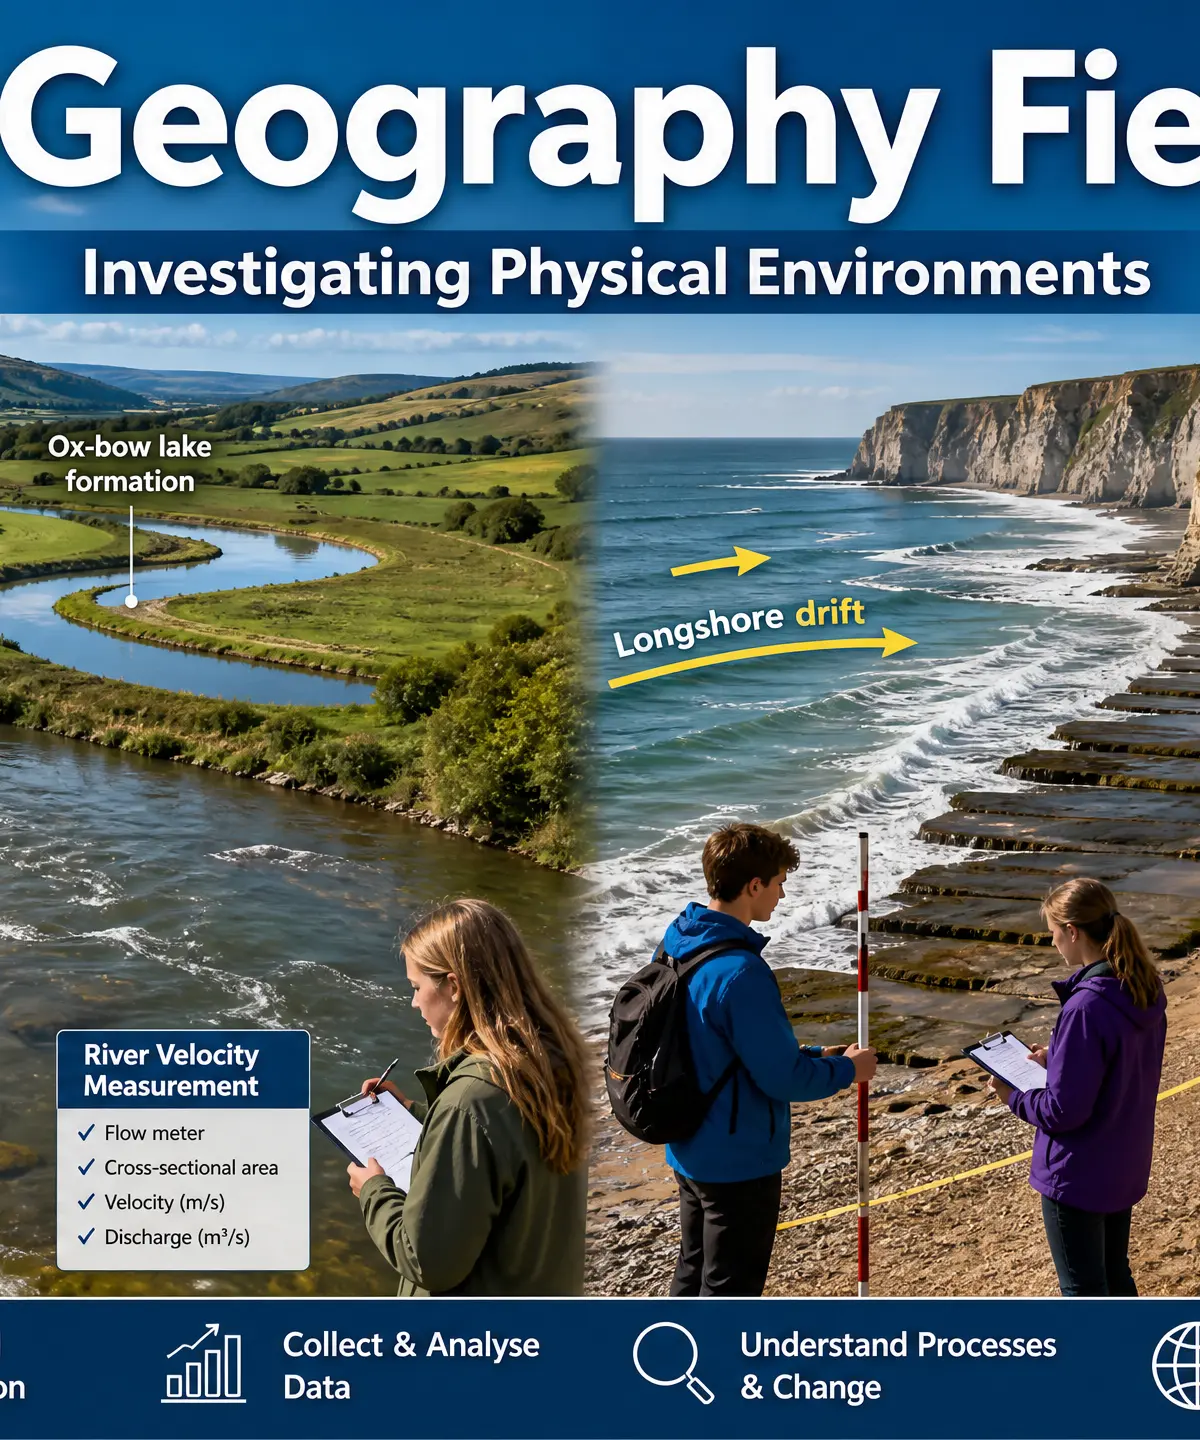
Fieldwork is a fundamental part of GCSE Geography, accounting for a significant portion of Paper 3 marks. The 'Investigating Physical Environments' topic requires candidates to understand the entire geographical enquiry cycle applied to either a river or coastal landscape. Examiners are not just testing what you did on your field trip; they are testing your understanding of why you did it, how you processed the data, and your ability to critically evaluate your methods and conclusions.
Crucially, candidates must be able to link physical processes (like erosion, transportation, and deposition) to their implications for people living in these environments. This means understanding flood risk for rivers or coastal erosion management for coasts. You must also demonstrate competence in using quantitative methods (measuring data with numbers) and qualitative methods (recording observations), alongside at least two secondary data sources.
The Podcast Guide
Listen to this 10-minute podcast where an expert Geography tutor walks you through the core concepts, common exam mistakes, and a quick-fire recall quiz.

The Geographical Enquiry Cycle
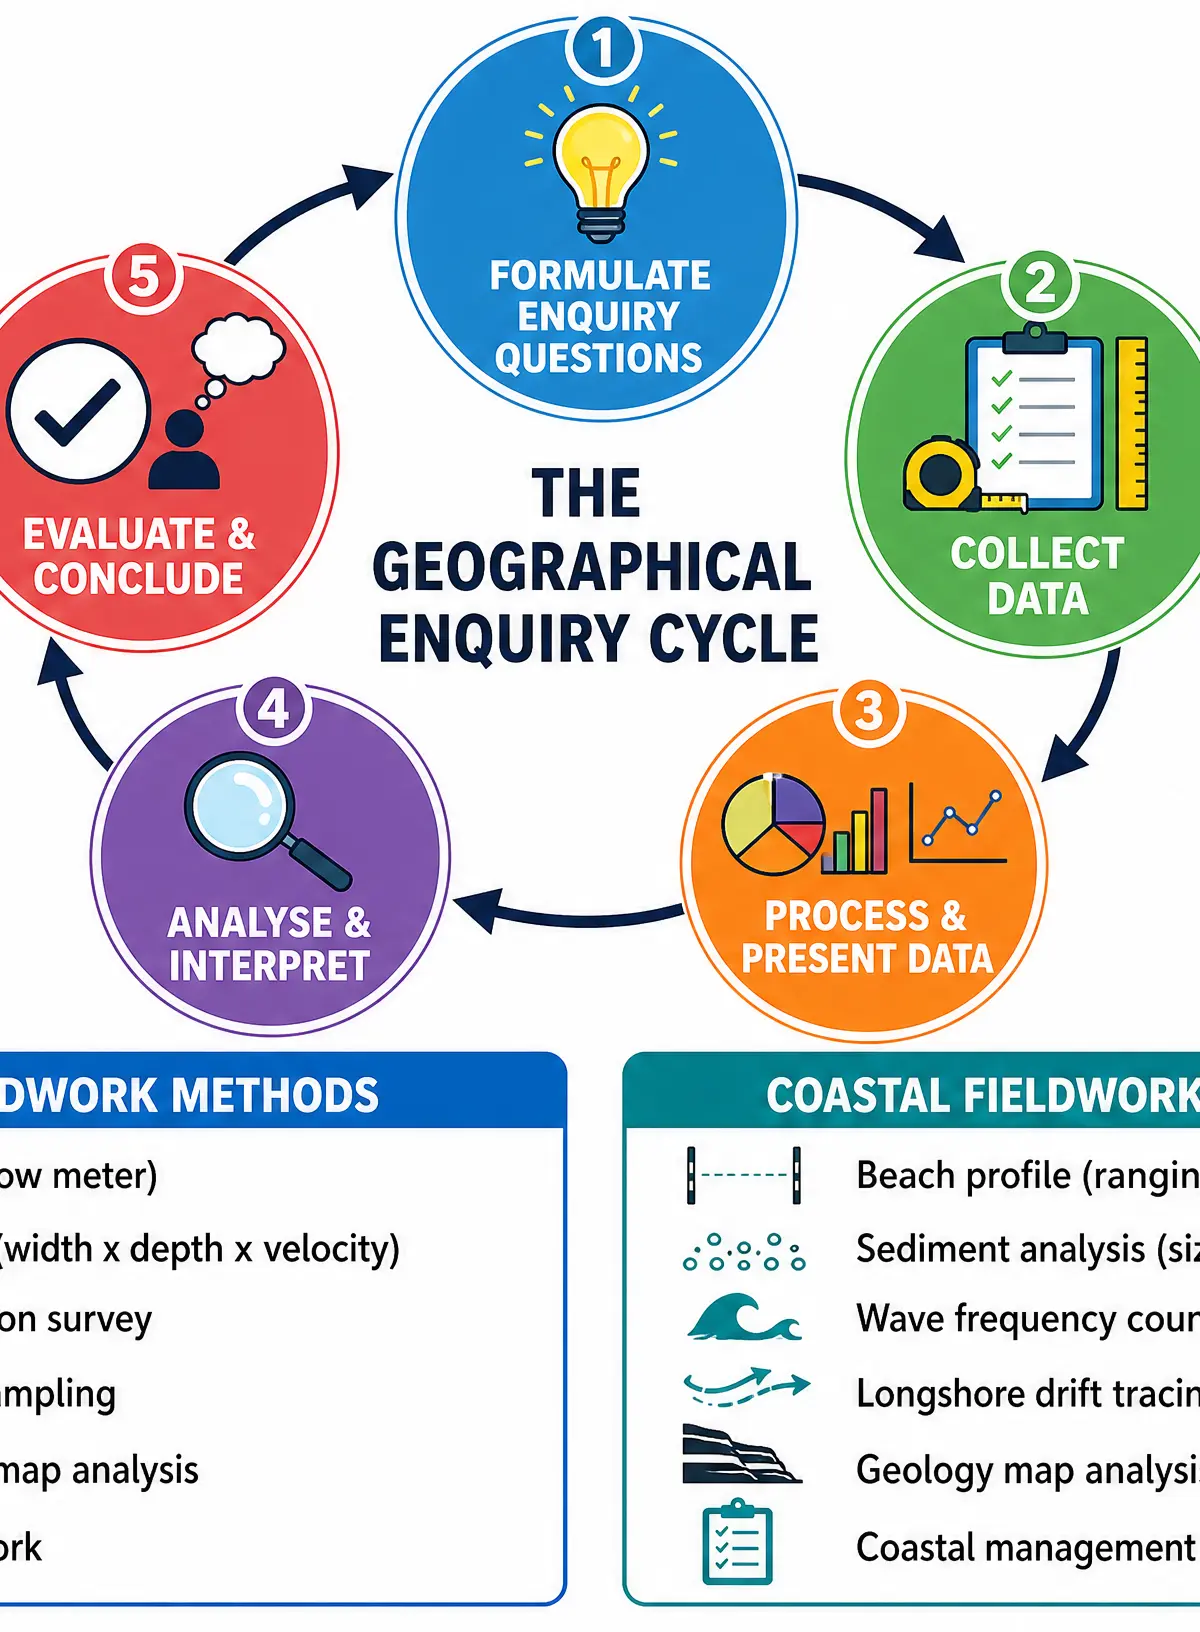
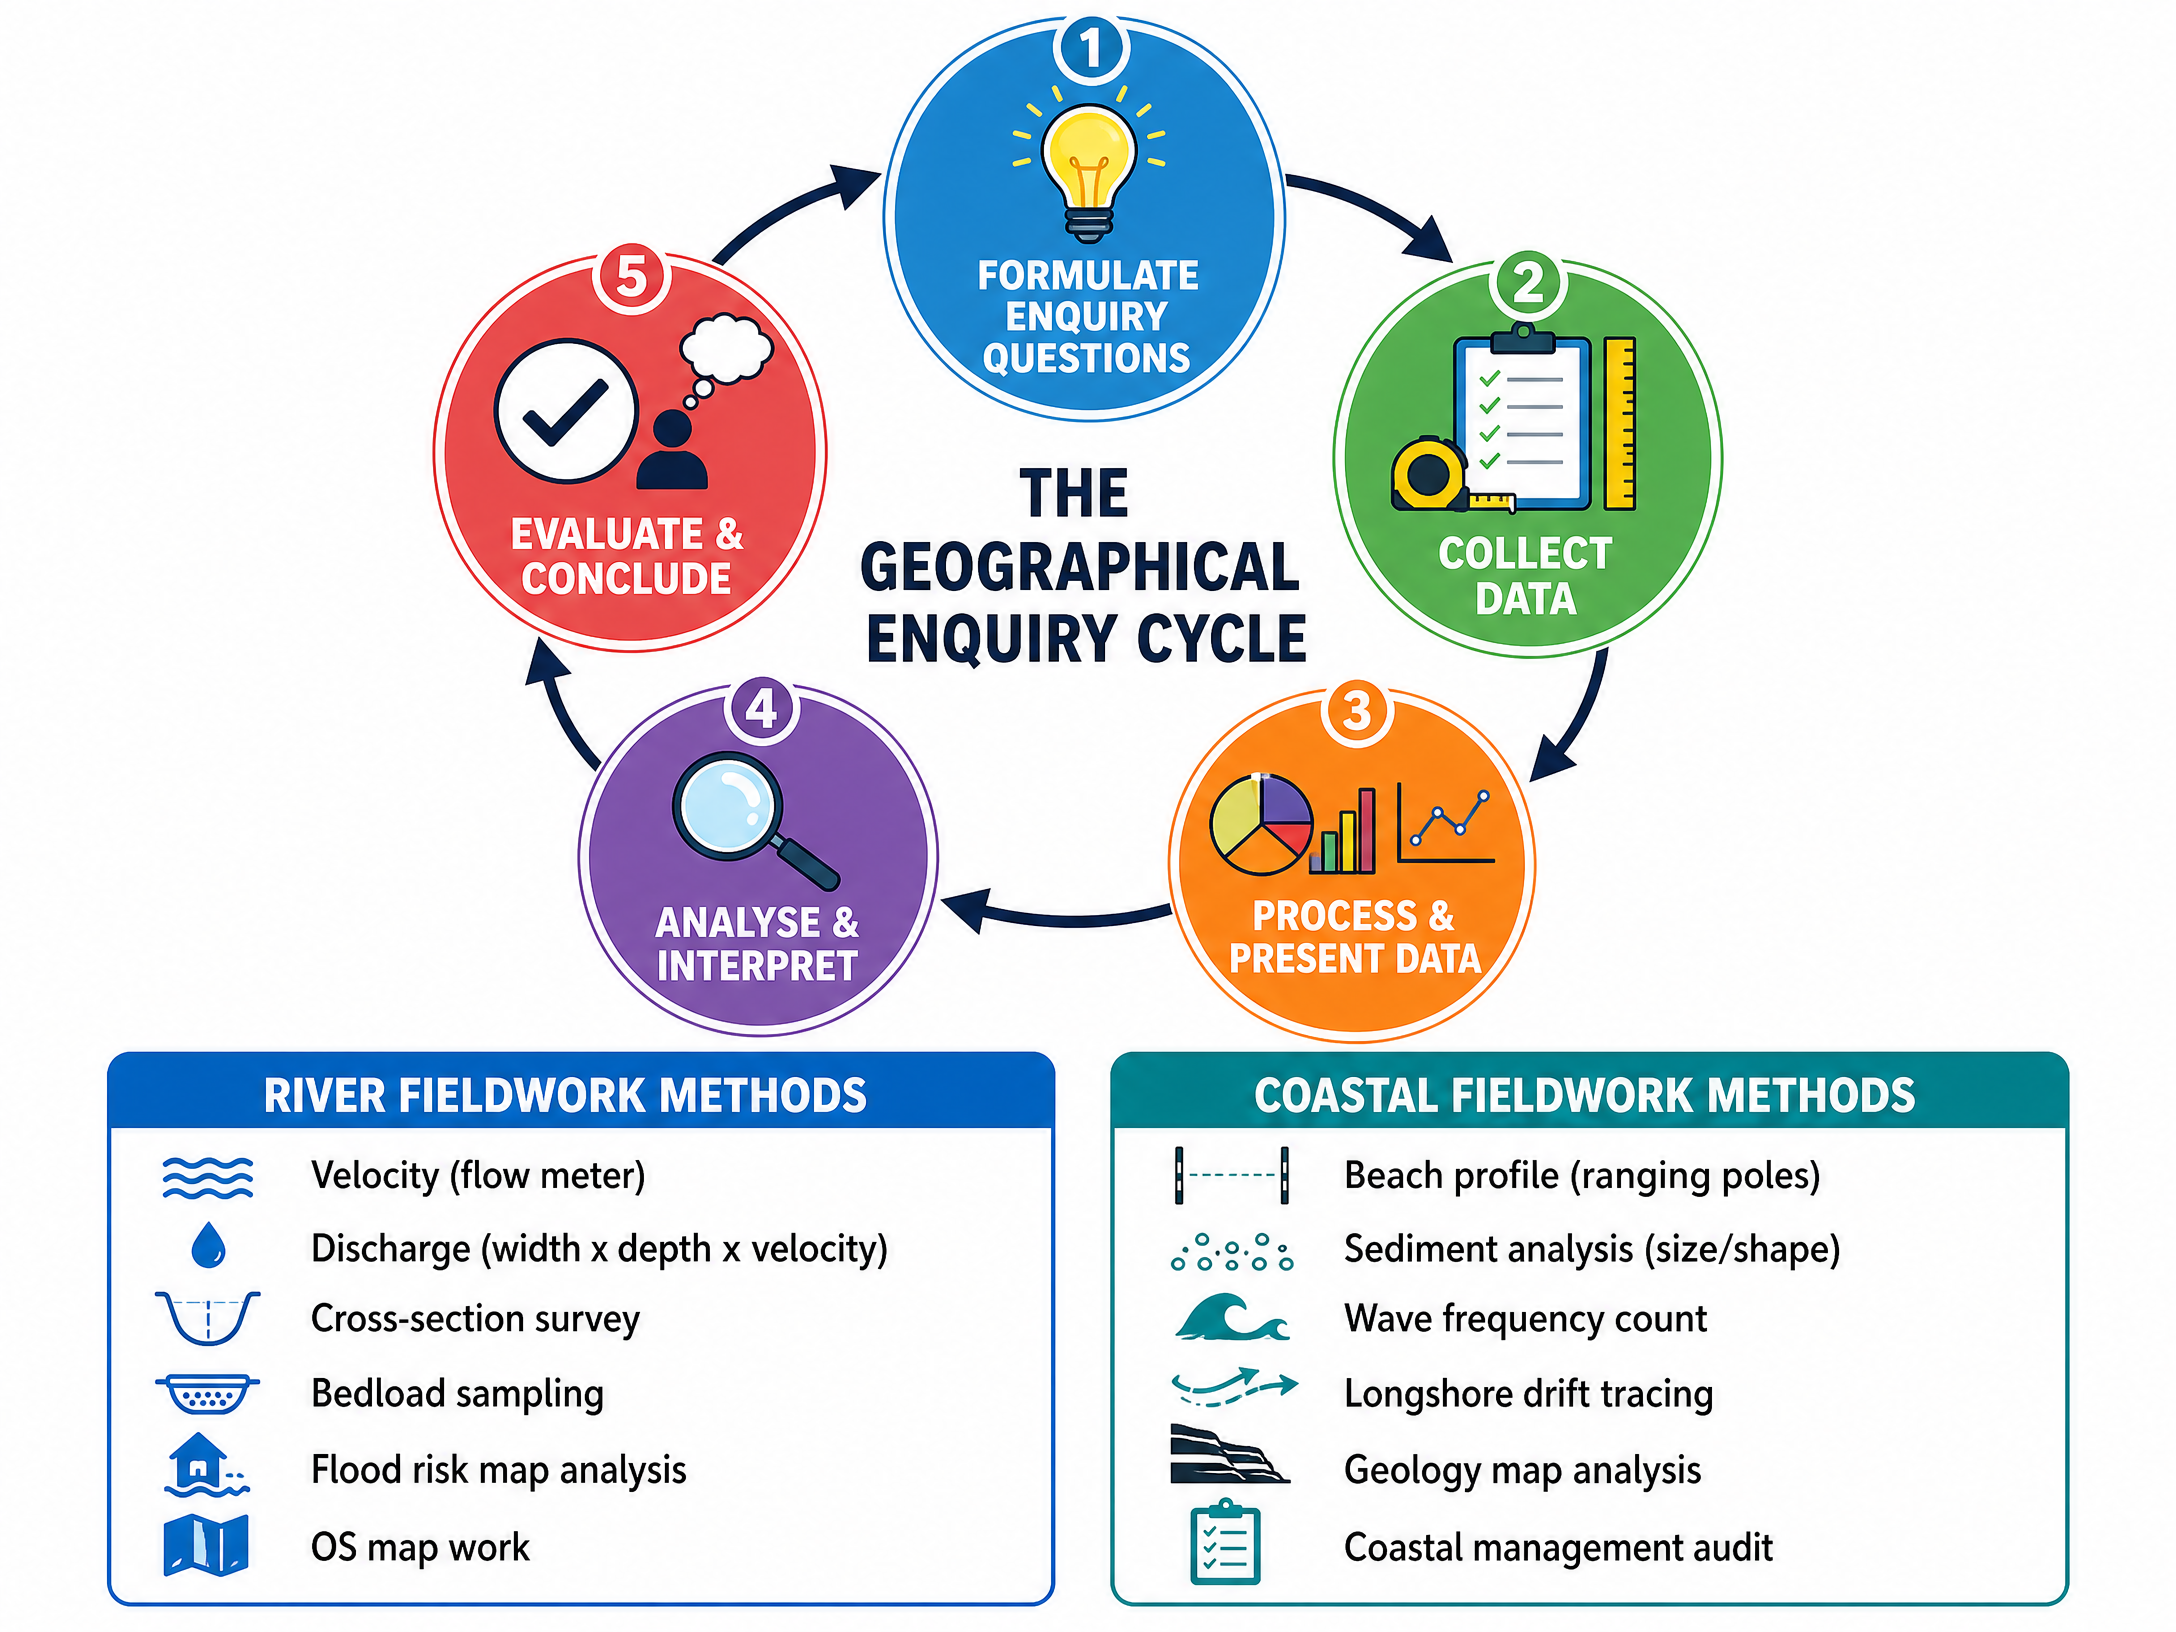
Every fieldwork investigation follows a five-stage cycle. Examiners will frame their questions around these specific stages:
- Formulating Enquiry Questions: Developing focused, measurable questions based on geographical theory.
- Collecting Data: Using primary fieldwork methods and secondary sources to gather information.
- Processing and Presenting Data: Turning raw data into graphs, charts, and maps.
- Analysing and Interpreting Data: Explaining what the data shows and why, linking back to theory.
- Evaluating and Concluding: Reflecting critically on the reliability of methods and answering the original enquiry question.
River Landscapes Fieldwork
Key Concepts & Processes
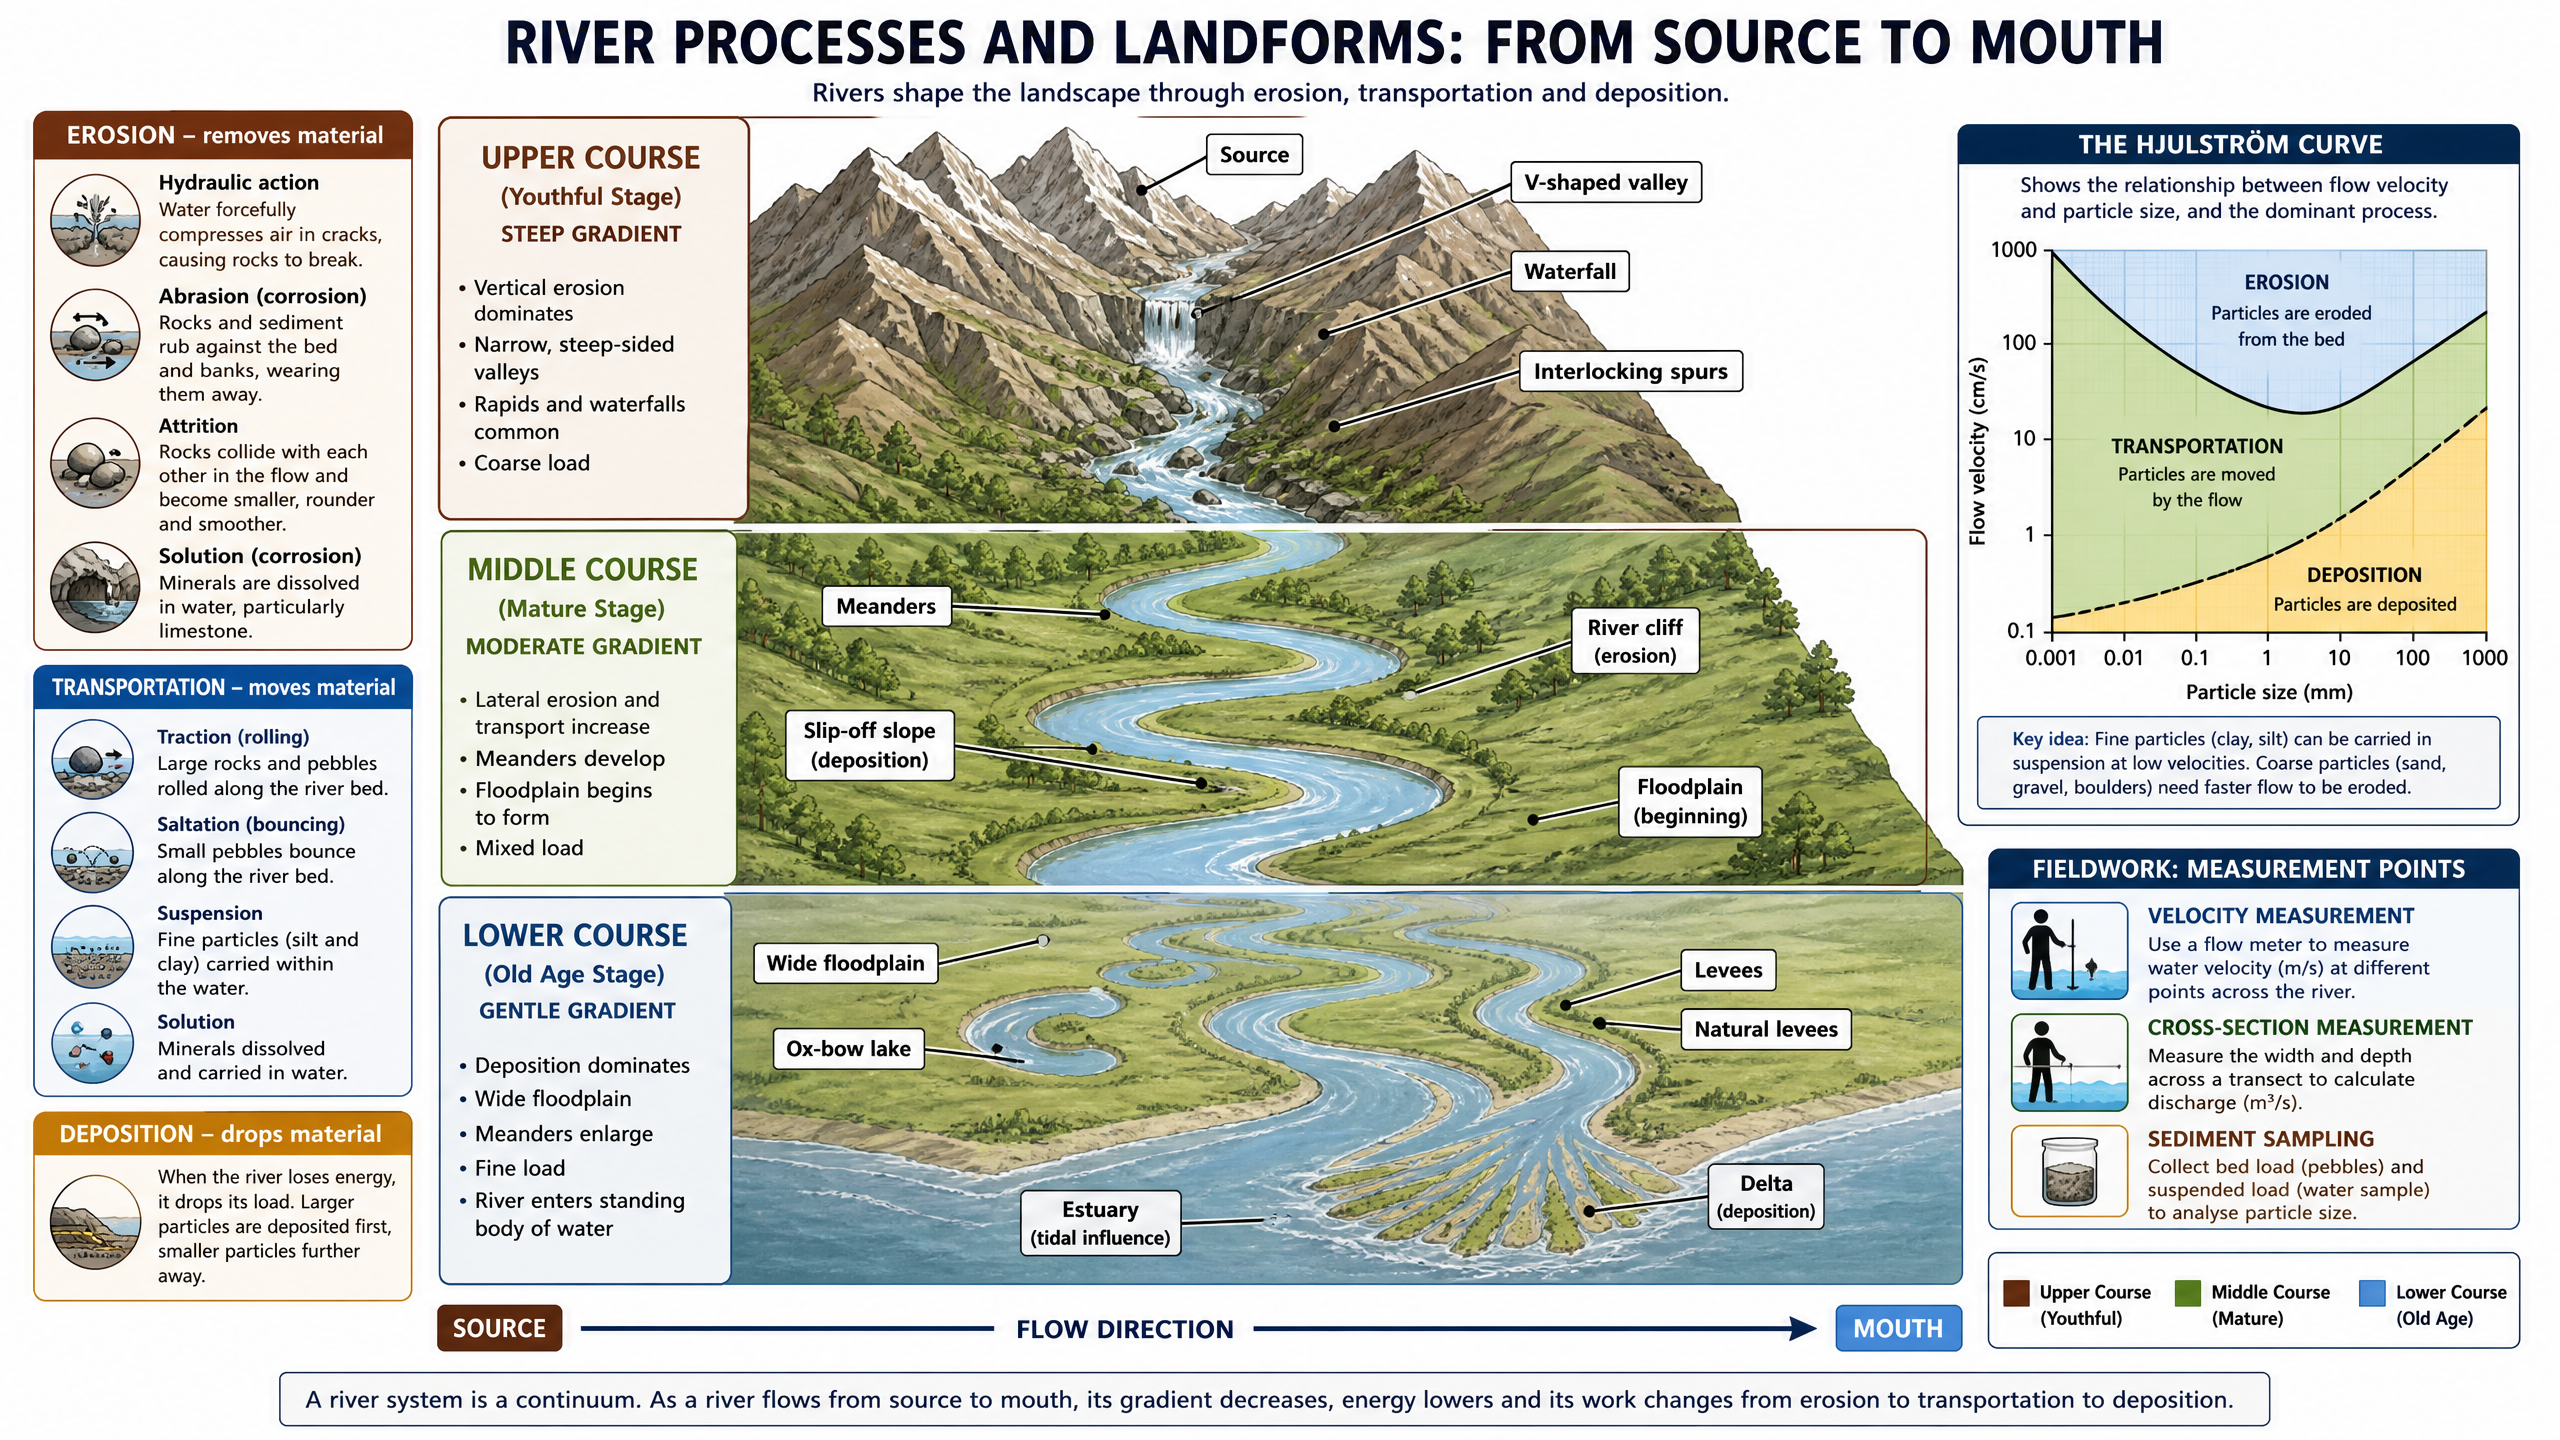
River investigations typically focus on how river characteristics change downstream, often testing the Bradshaw Model. Key physical processes include erosion (hydraulic action, abrasion, attrition, solution), transportation (traction, saltation, suspension, solution), and deposition.
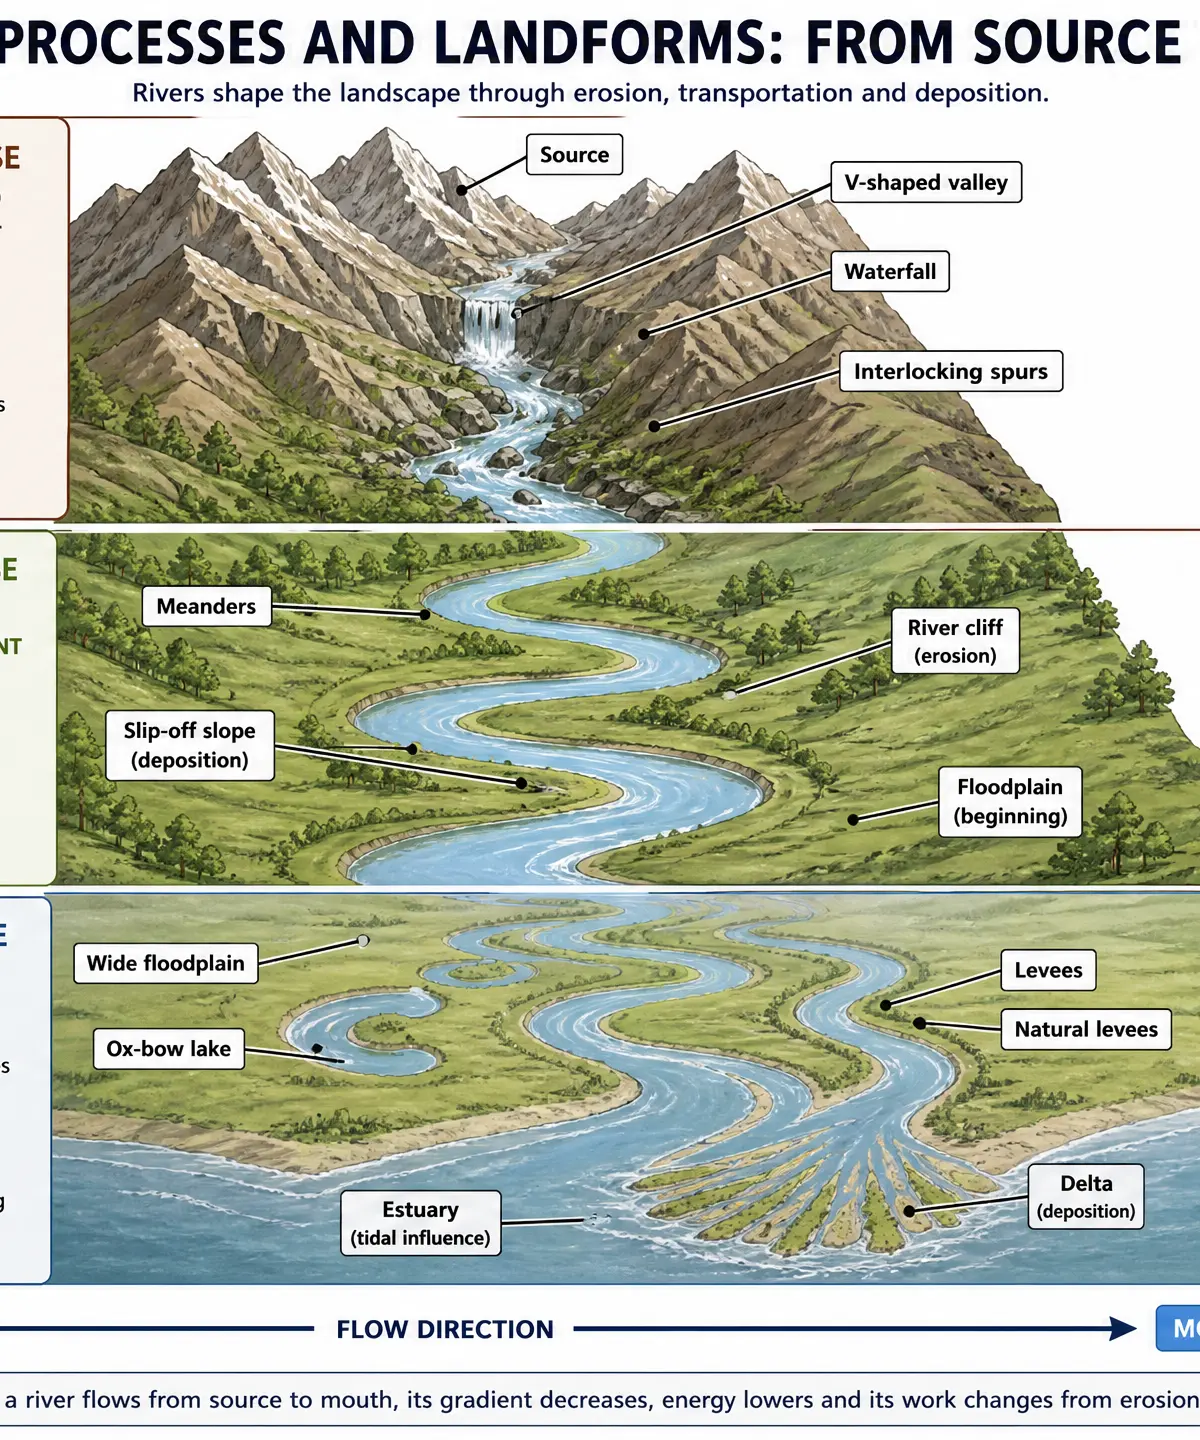
Quantitative Methods:
- Velocity: Measured using a flow meter or float method at intervals across the channel.
- Discharge: Calculated using Cross-sectional Area \times Velocity (m^3/s).
- Sediment Size: Measured using callipers to find the long axis of bedload samples.
Qualitative Methods:
- Field sketches of landforms (e.g., meanders, slip-off slopes).
- Environmental quality surveys.
Secondary Data:
- Ordnance Survey (OS) maps to determine drainage basin characteristics and gradient.
- Environment Agency flood risk maps to assess implications for local communities.
Coastal Landscapes Fieldwork
Key Concepts & Processes
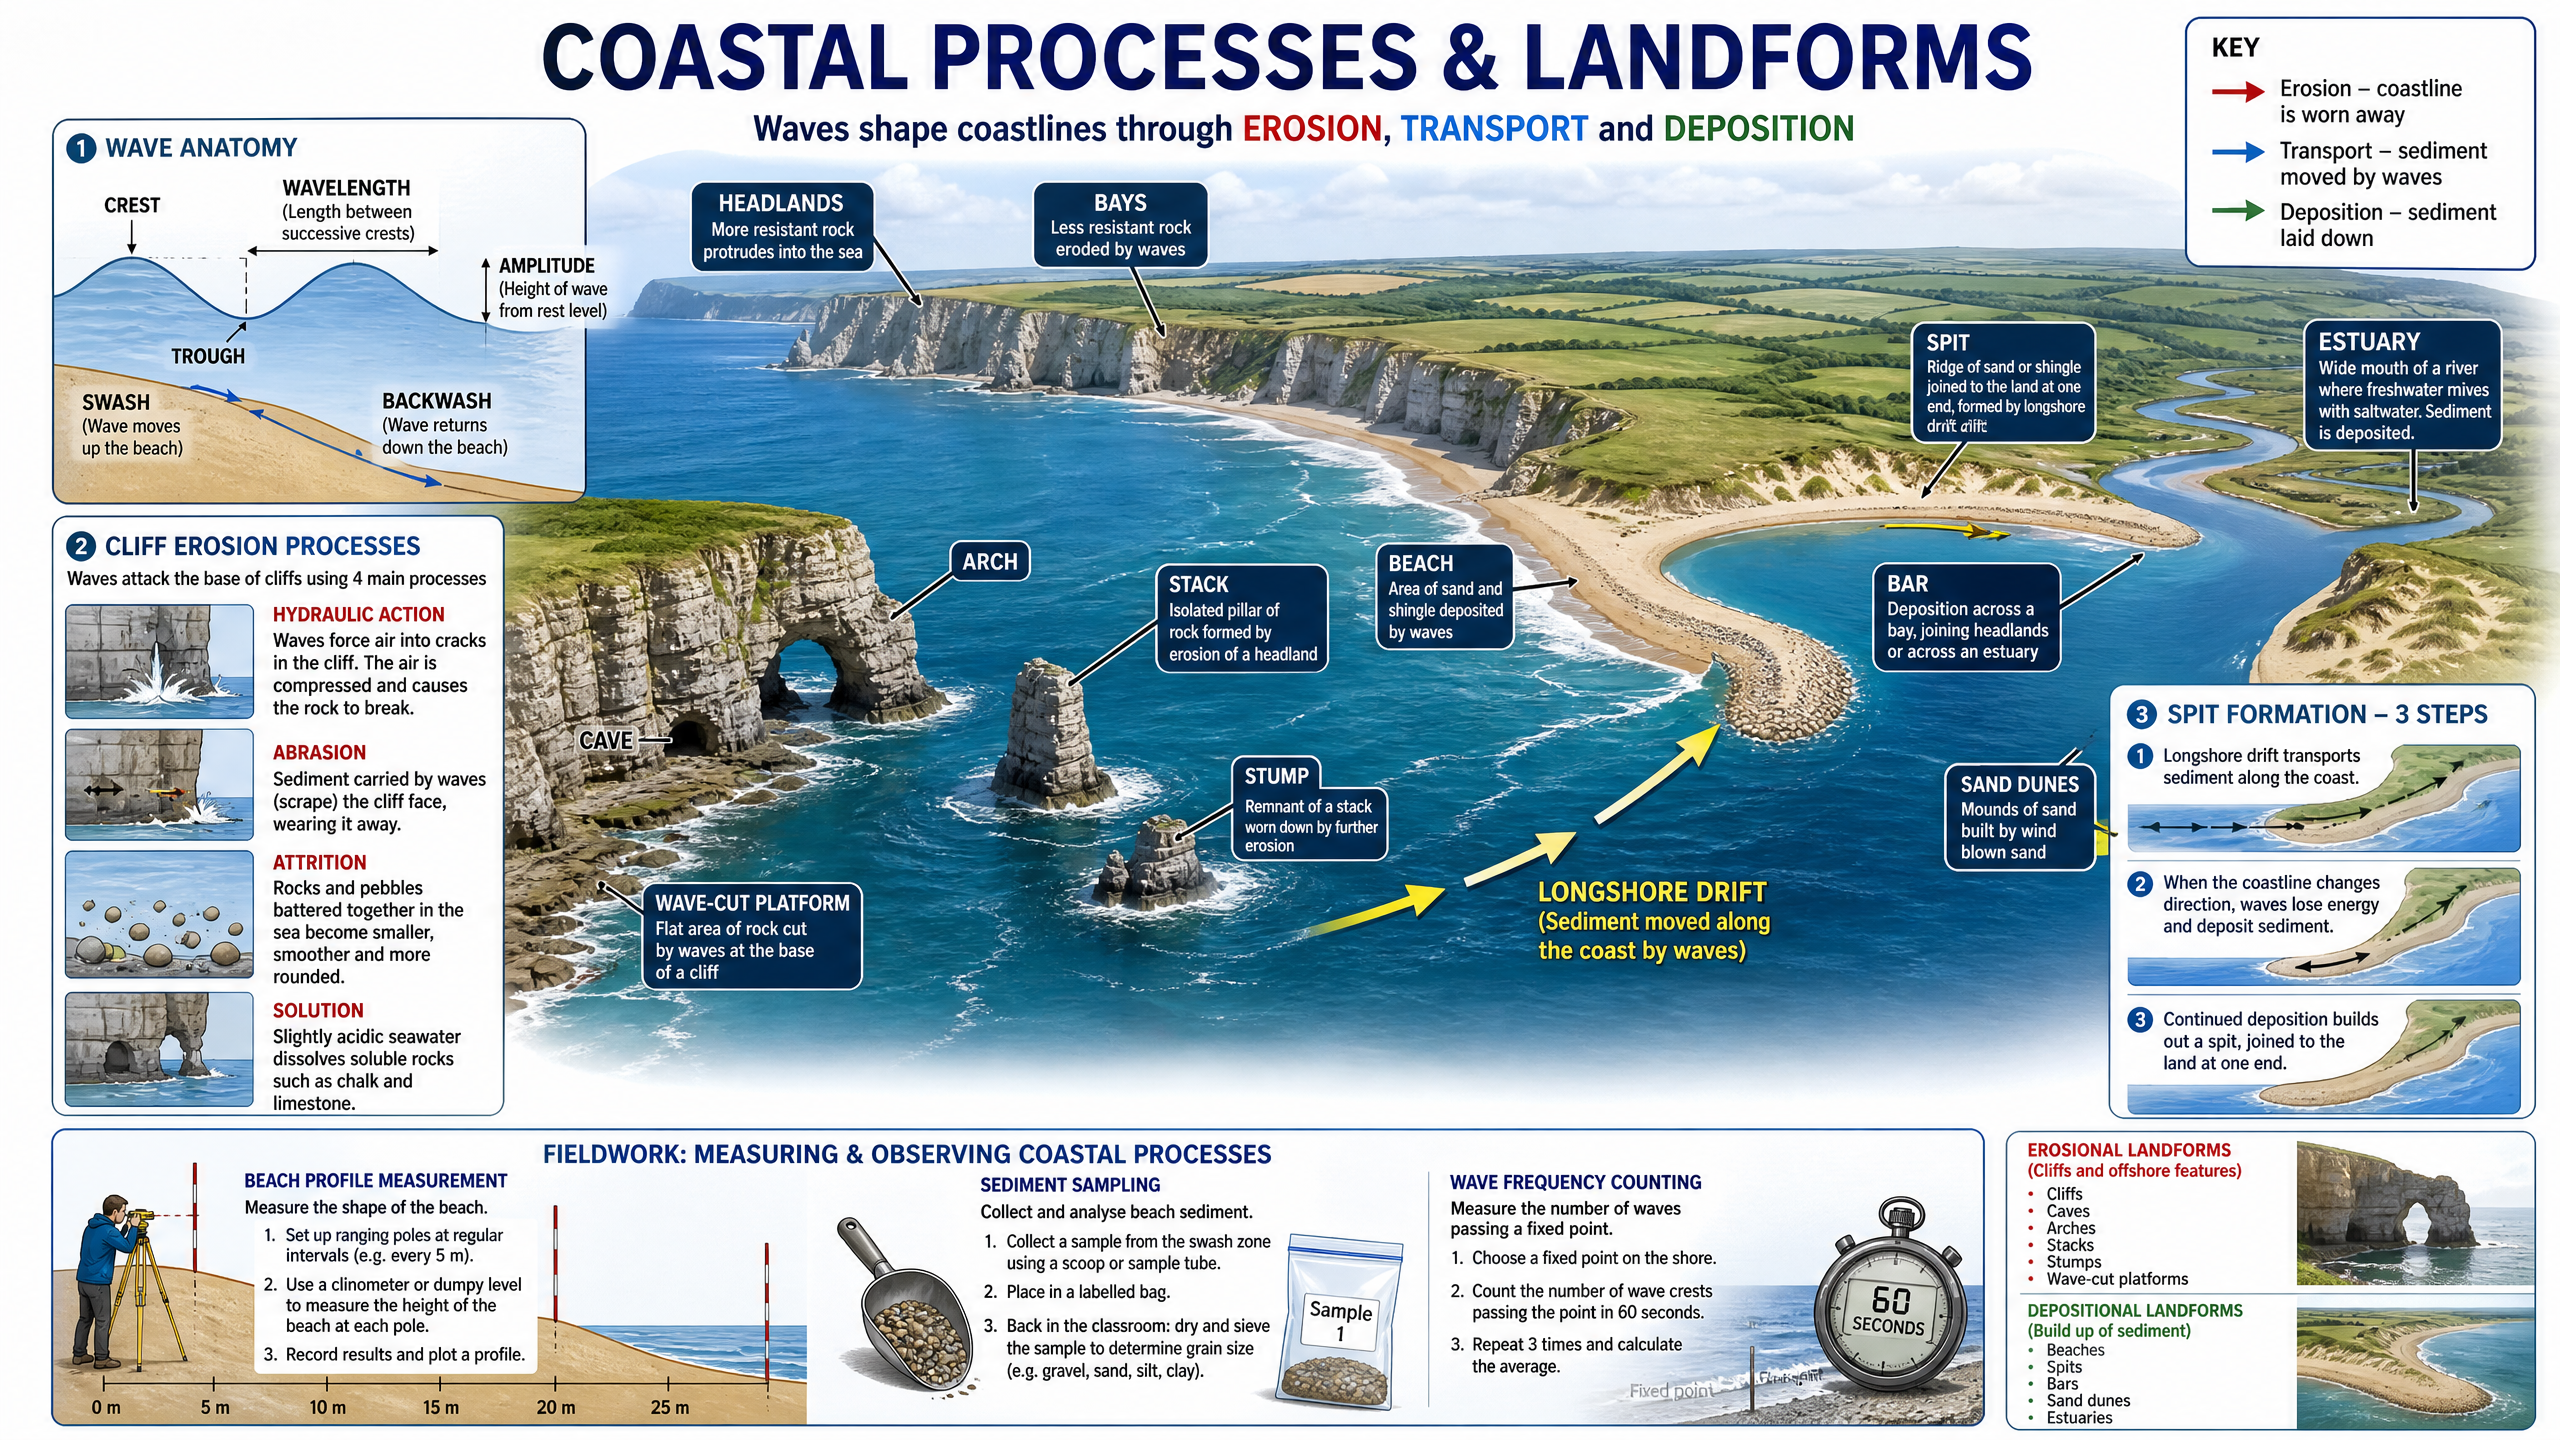
Coastal investigations often focus on beach morphology, sediment characteristics, or the impact of coastal management. Key processes include wave action (constructive vs. destructive), longshore drift, and coastal erosion.
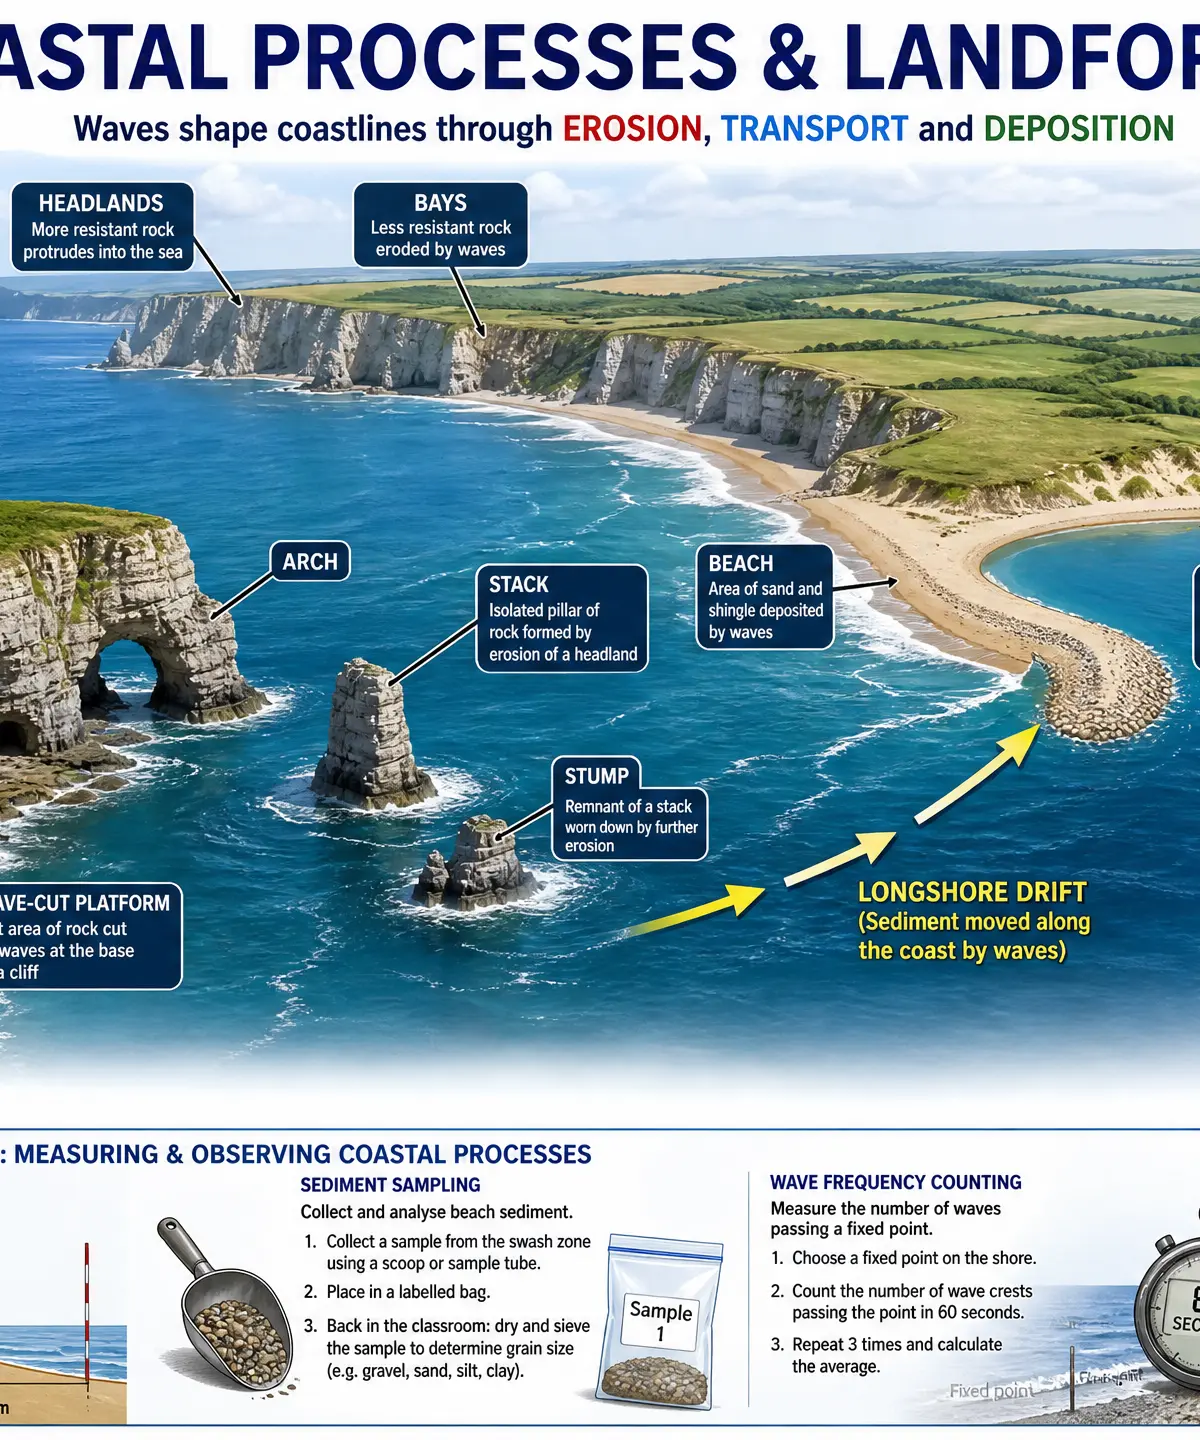
Quantitative Methods:
- Beach Profile: Measured using ranging poles and a clinometer to determine the gradient at regular intervals.
- Sediment Analysis: Using the Power's roundness scale and callipers to assess sorting and attrition.
- Wave Frequency: Counting the number of waves breaking per minute to determine wave type.
Qualitative Methods:
- Annotated photographs of coastal landforms (cliffs, arches, stacks).
- Bipolar surveys evaluating the condition of coastal defences (e.g., groynes, sea walls).
Secondary Data:
- British Geological Survey (BGS) maps to understand rock type and resistance.
- Historical maps or aerial photographs to calculate rates of coastal retreat.
Visual Resources
3 diagrams and illustrations
Interactive Diagrams
1 interactive diagram to visualise key concepts
Conceptual Flow Outline
The Geographical Enquiry Cycle
Worked Examples
3 worked examples — open one to explore the question and available guidance.
Practice Questions
Test your understanding — click to reveal model answers
Identify one potential risk in your physical geography fieldwork and explain how you managed it. (3 marks)
Hint: Name a specific hazard related to water or weather, and give a concrete action taken to reduce the risk.
Suggest one way your primary data collection method could be adapted to improve the reliability of your results. (3 marks)
Hint: Think about sample size, timing, or equipment accuracy.
Explain why it was appropriate to use a line graph to present your fieldwork data. (2 marks)
Hint: What kind of data does a line graph show best?
To what extent did your fieldwork conclusions support geographical theory? (9 marks + 3 SPaG)
Hint: State the theory (e.g., Bradshaw model). Explain where your data matched it, where it didn't (anomalies), and conclude why.
Justify your choice of one data presentation technique used in your physical geography enquiry. (4 marks)
Hint: Name the technique (e.g., scatter graph, proportional symbols). Say what it shows clearly, and why that helped your specific enquiry.