Pearson Edexcel · GCSE · Geography
The supply of fresh water supply varies globally
Water is life, yet its distribution across our planet is highly uneven. This study guide explores why some regions face devastating water deficits while others enjoy abundant surplus, and how human actions over the last 50 years have dramatically altered global fresh water supply and demand.
- 5 min read
- 3 worked examples
- 5 practice questions
- 6 key terms
Study Notes
Overview
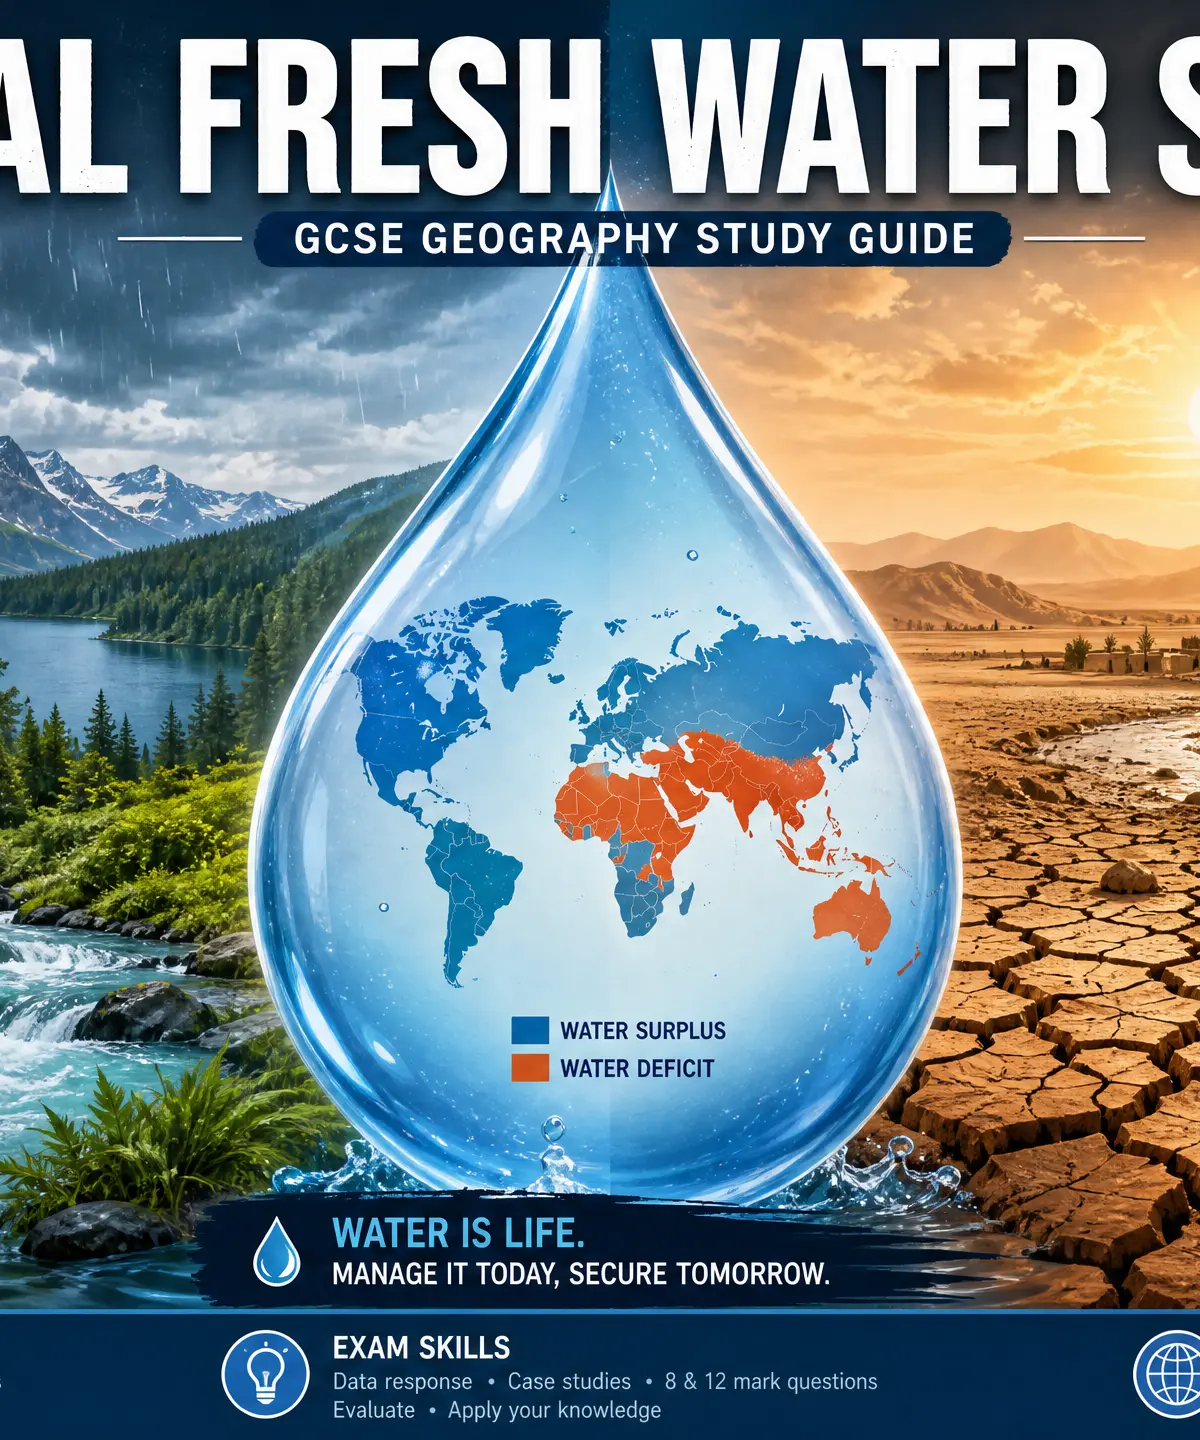
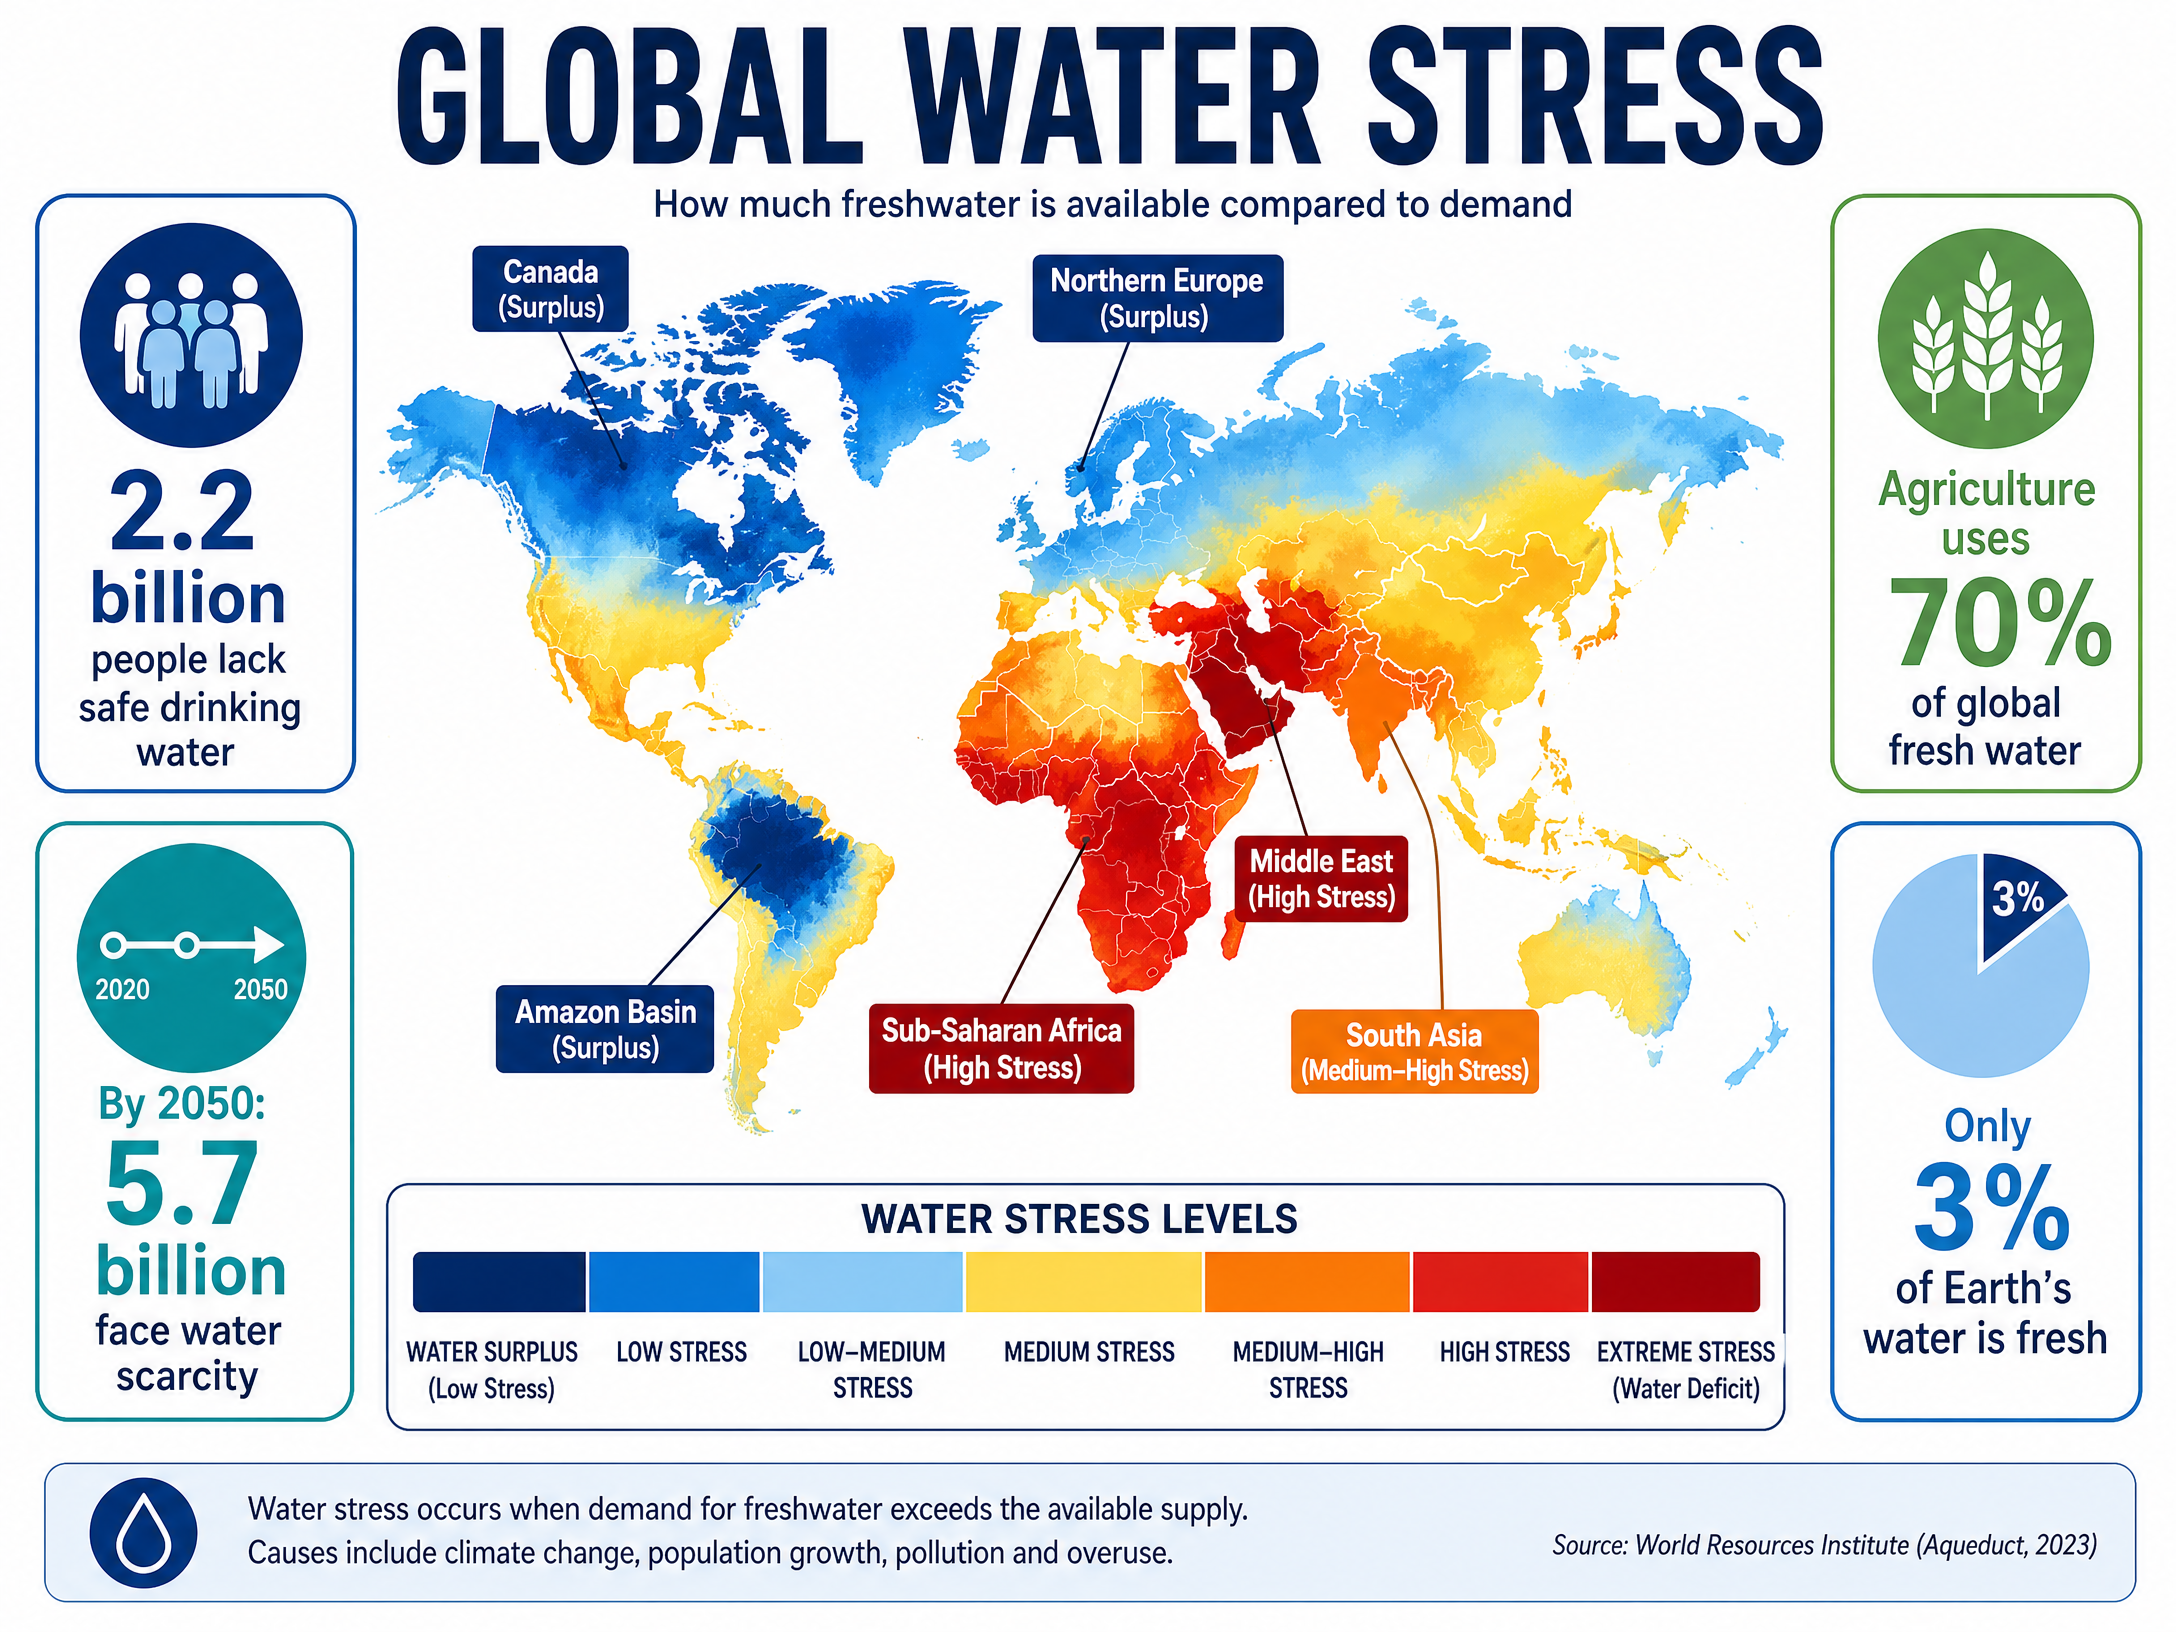
Only 3% of Earth's water is fresh water, and the vast majority of this is locked away in ice caps and glaciers. The remaining accessible fresh water is unevenly distributed across the globe. This topic is fundamental to GCSE Geography as it connects physical processes (climate and geology) with human actions (population growth, economic development, and agriculture). Examiners expect candidates to confidently use named examples, interpret maps showing global water stress, and explain how human intervention has changed the delicate balance of supply and demand over the last 50 years.

Global Distribution of Fresh Water
Water Surplus Regions
Characteristics: Areas where water supply exceeds demand.
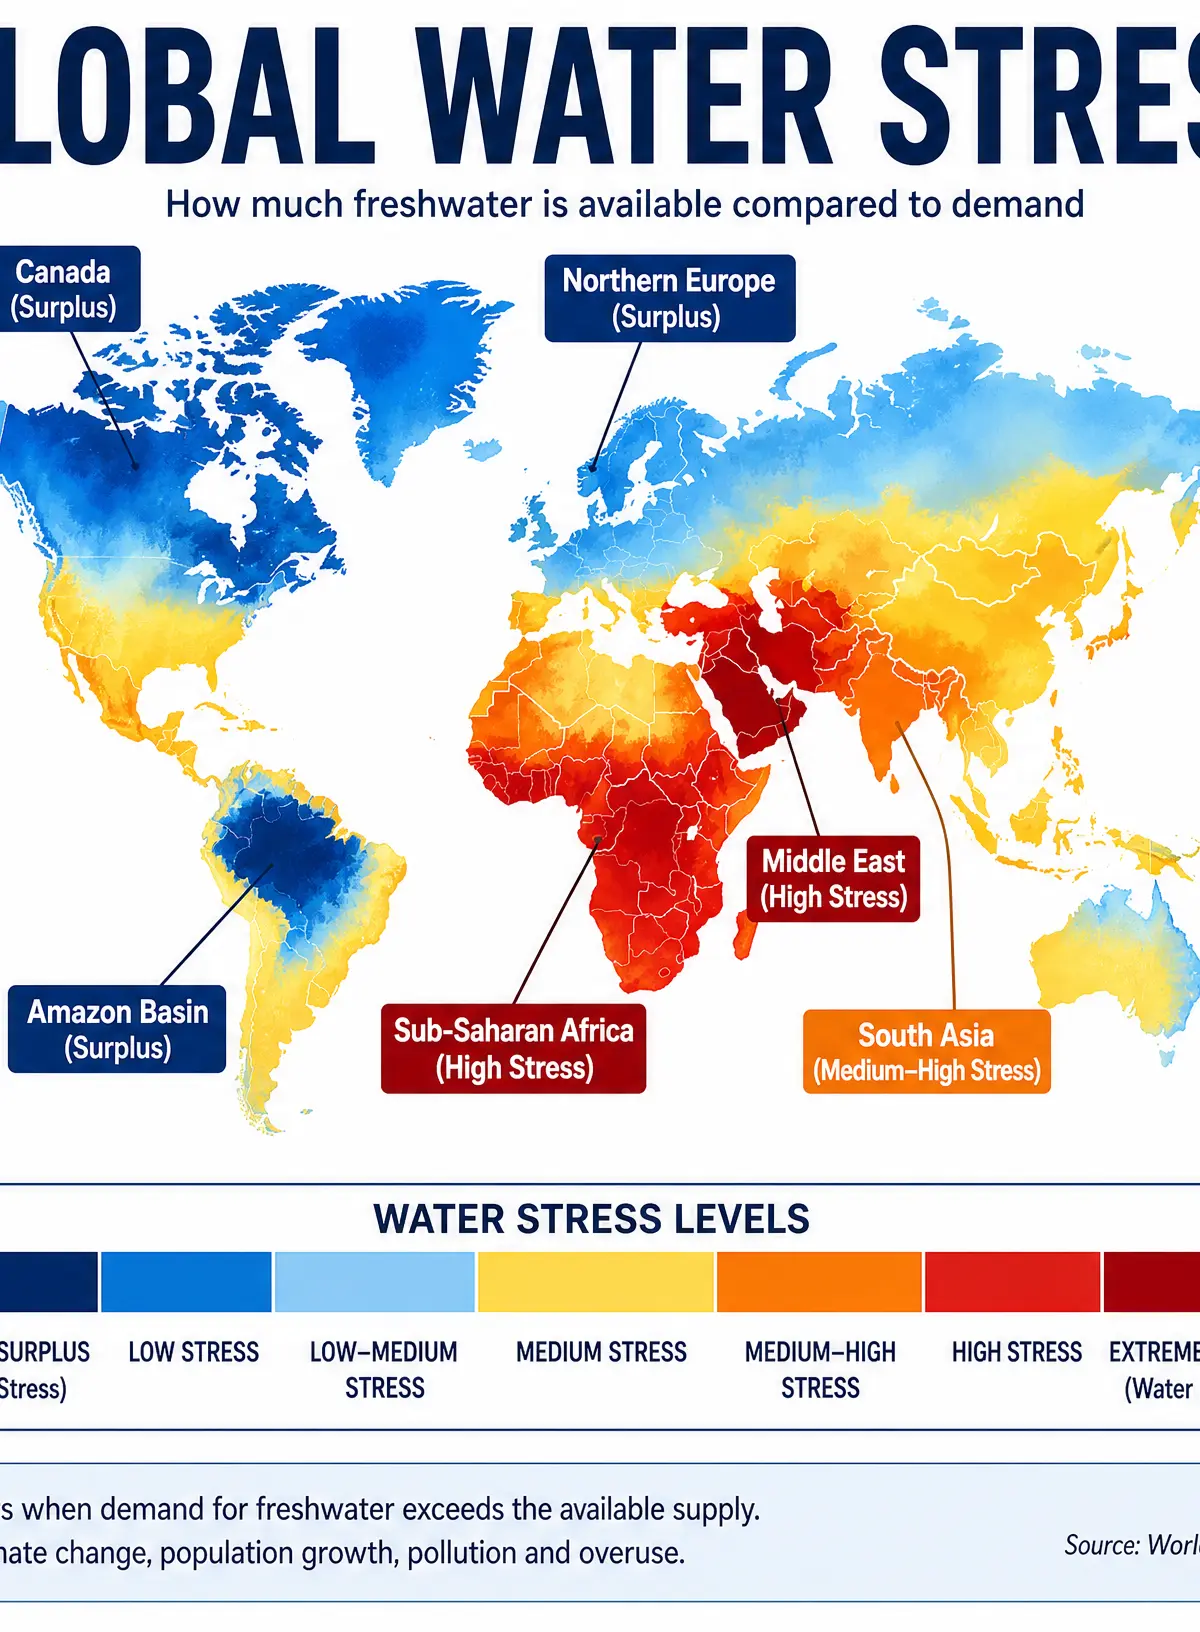
Locations: Equatorial regions (Amazon Basin, Congo Basin), Northern Europe, Canada, and parts of Southeast Asia.
Reasons: High annual precipitation, low evaporation rates (in cooler climates), and relatively low population density compared to water availability.
Water Deficit Regions
Characteristics: Areas where water demand exceeds supply, leading to water stress.
Locations: Sub-Saharan Africa (Sahel region), the Middle East (Saudi Arabia, Yemen), parts of South Asia, and the Australian Outback.
Reasons: Low and unreliable rainfall, high evaporation rates, and often rapidly growing populations.
Physical Factors Affecting Supply
Climate
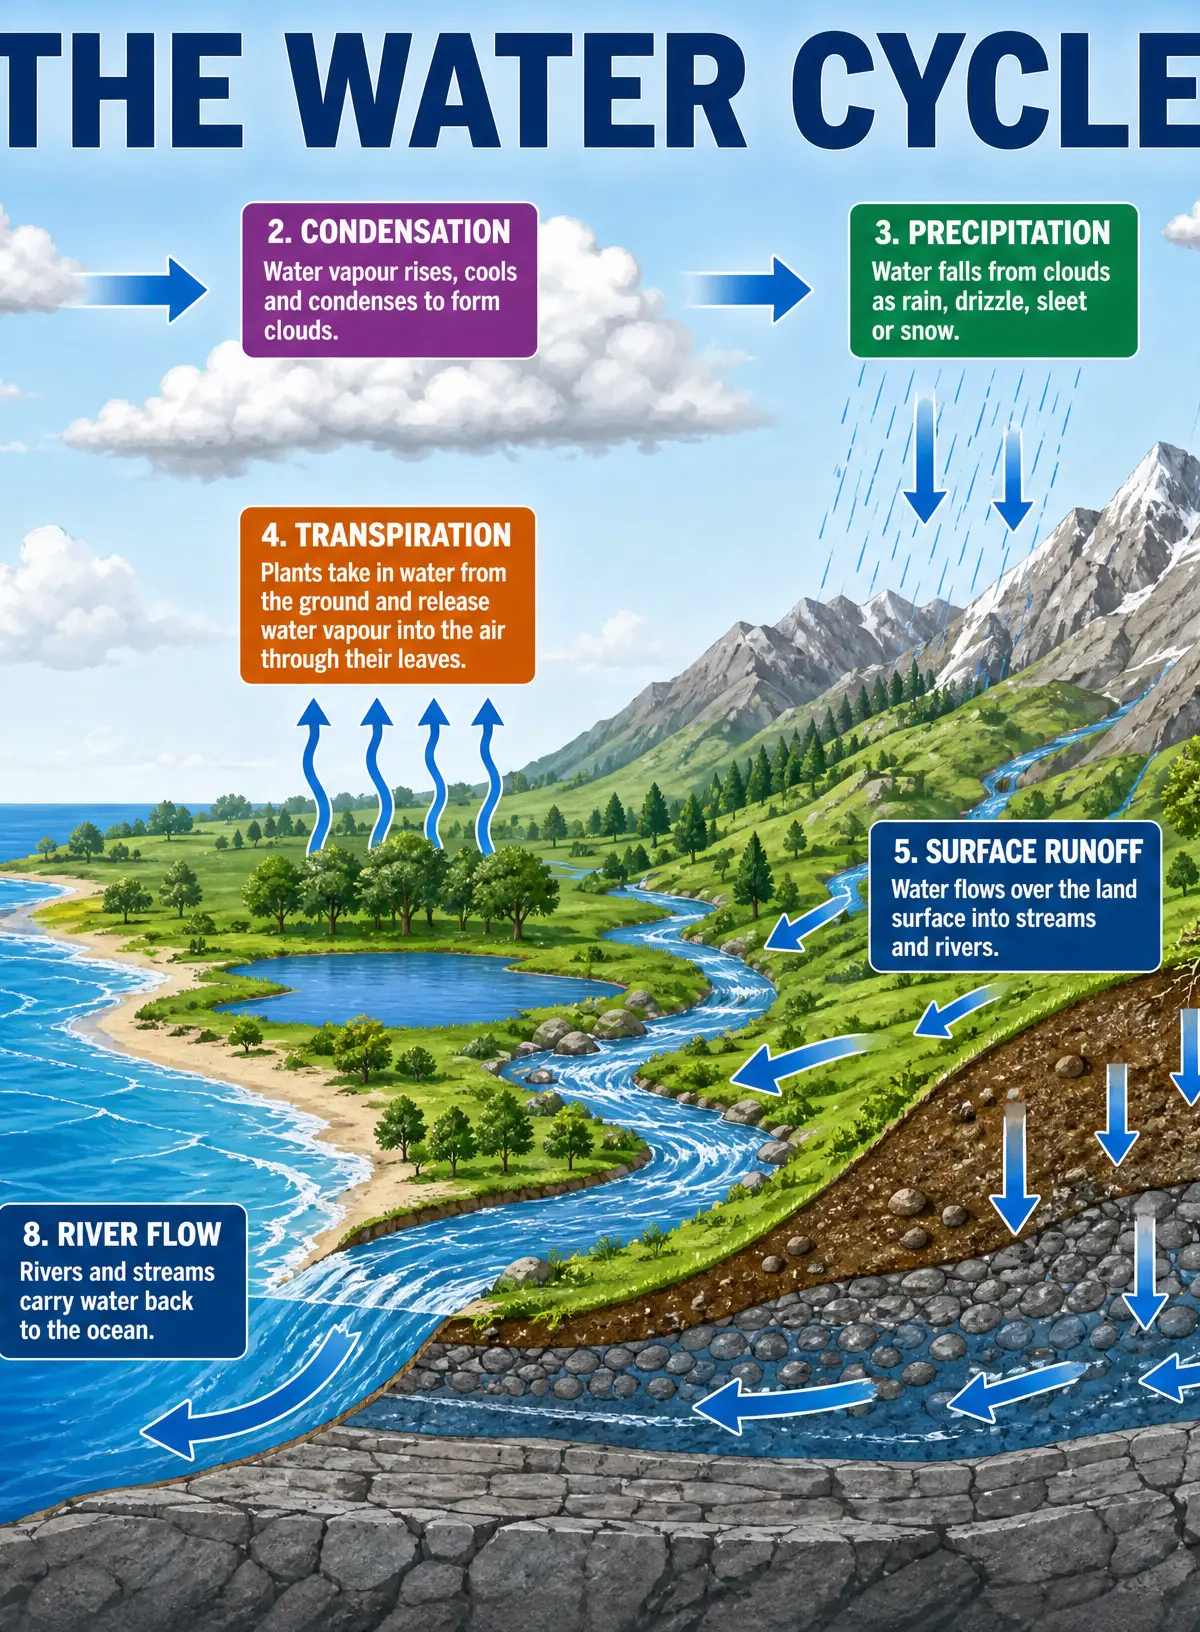
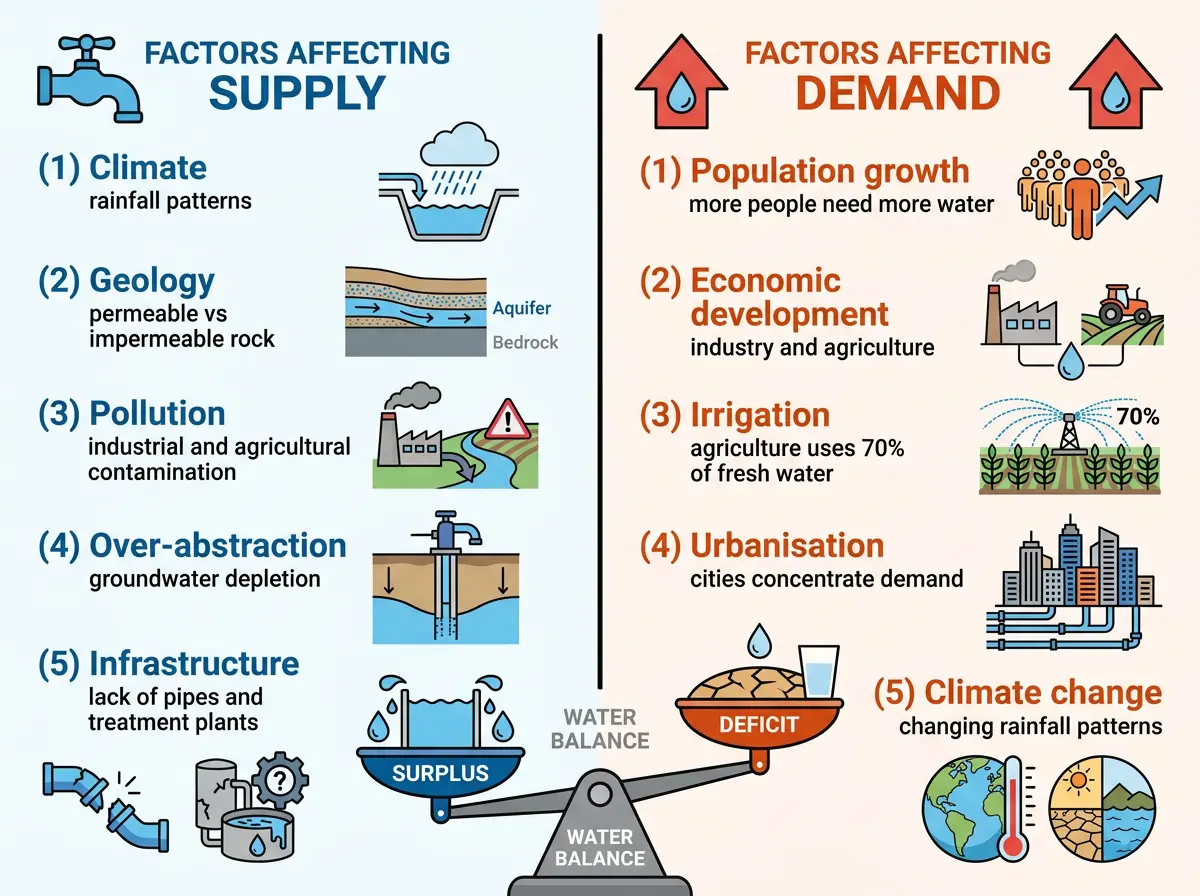
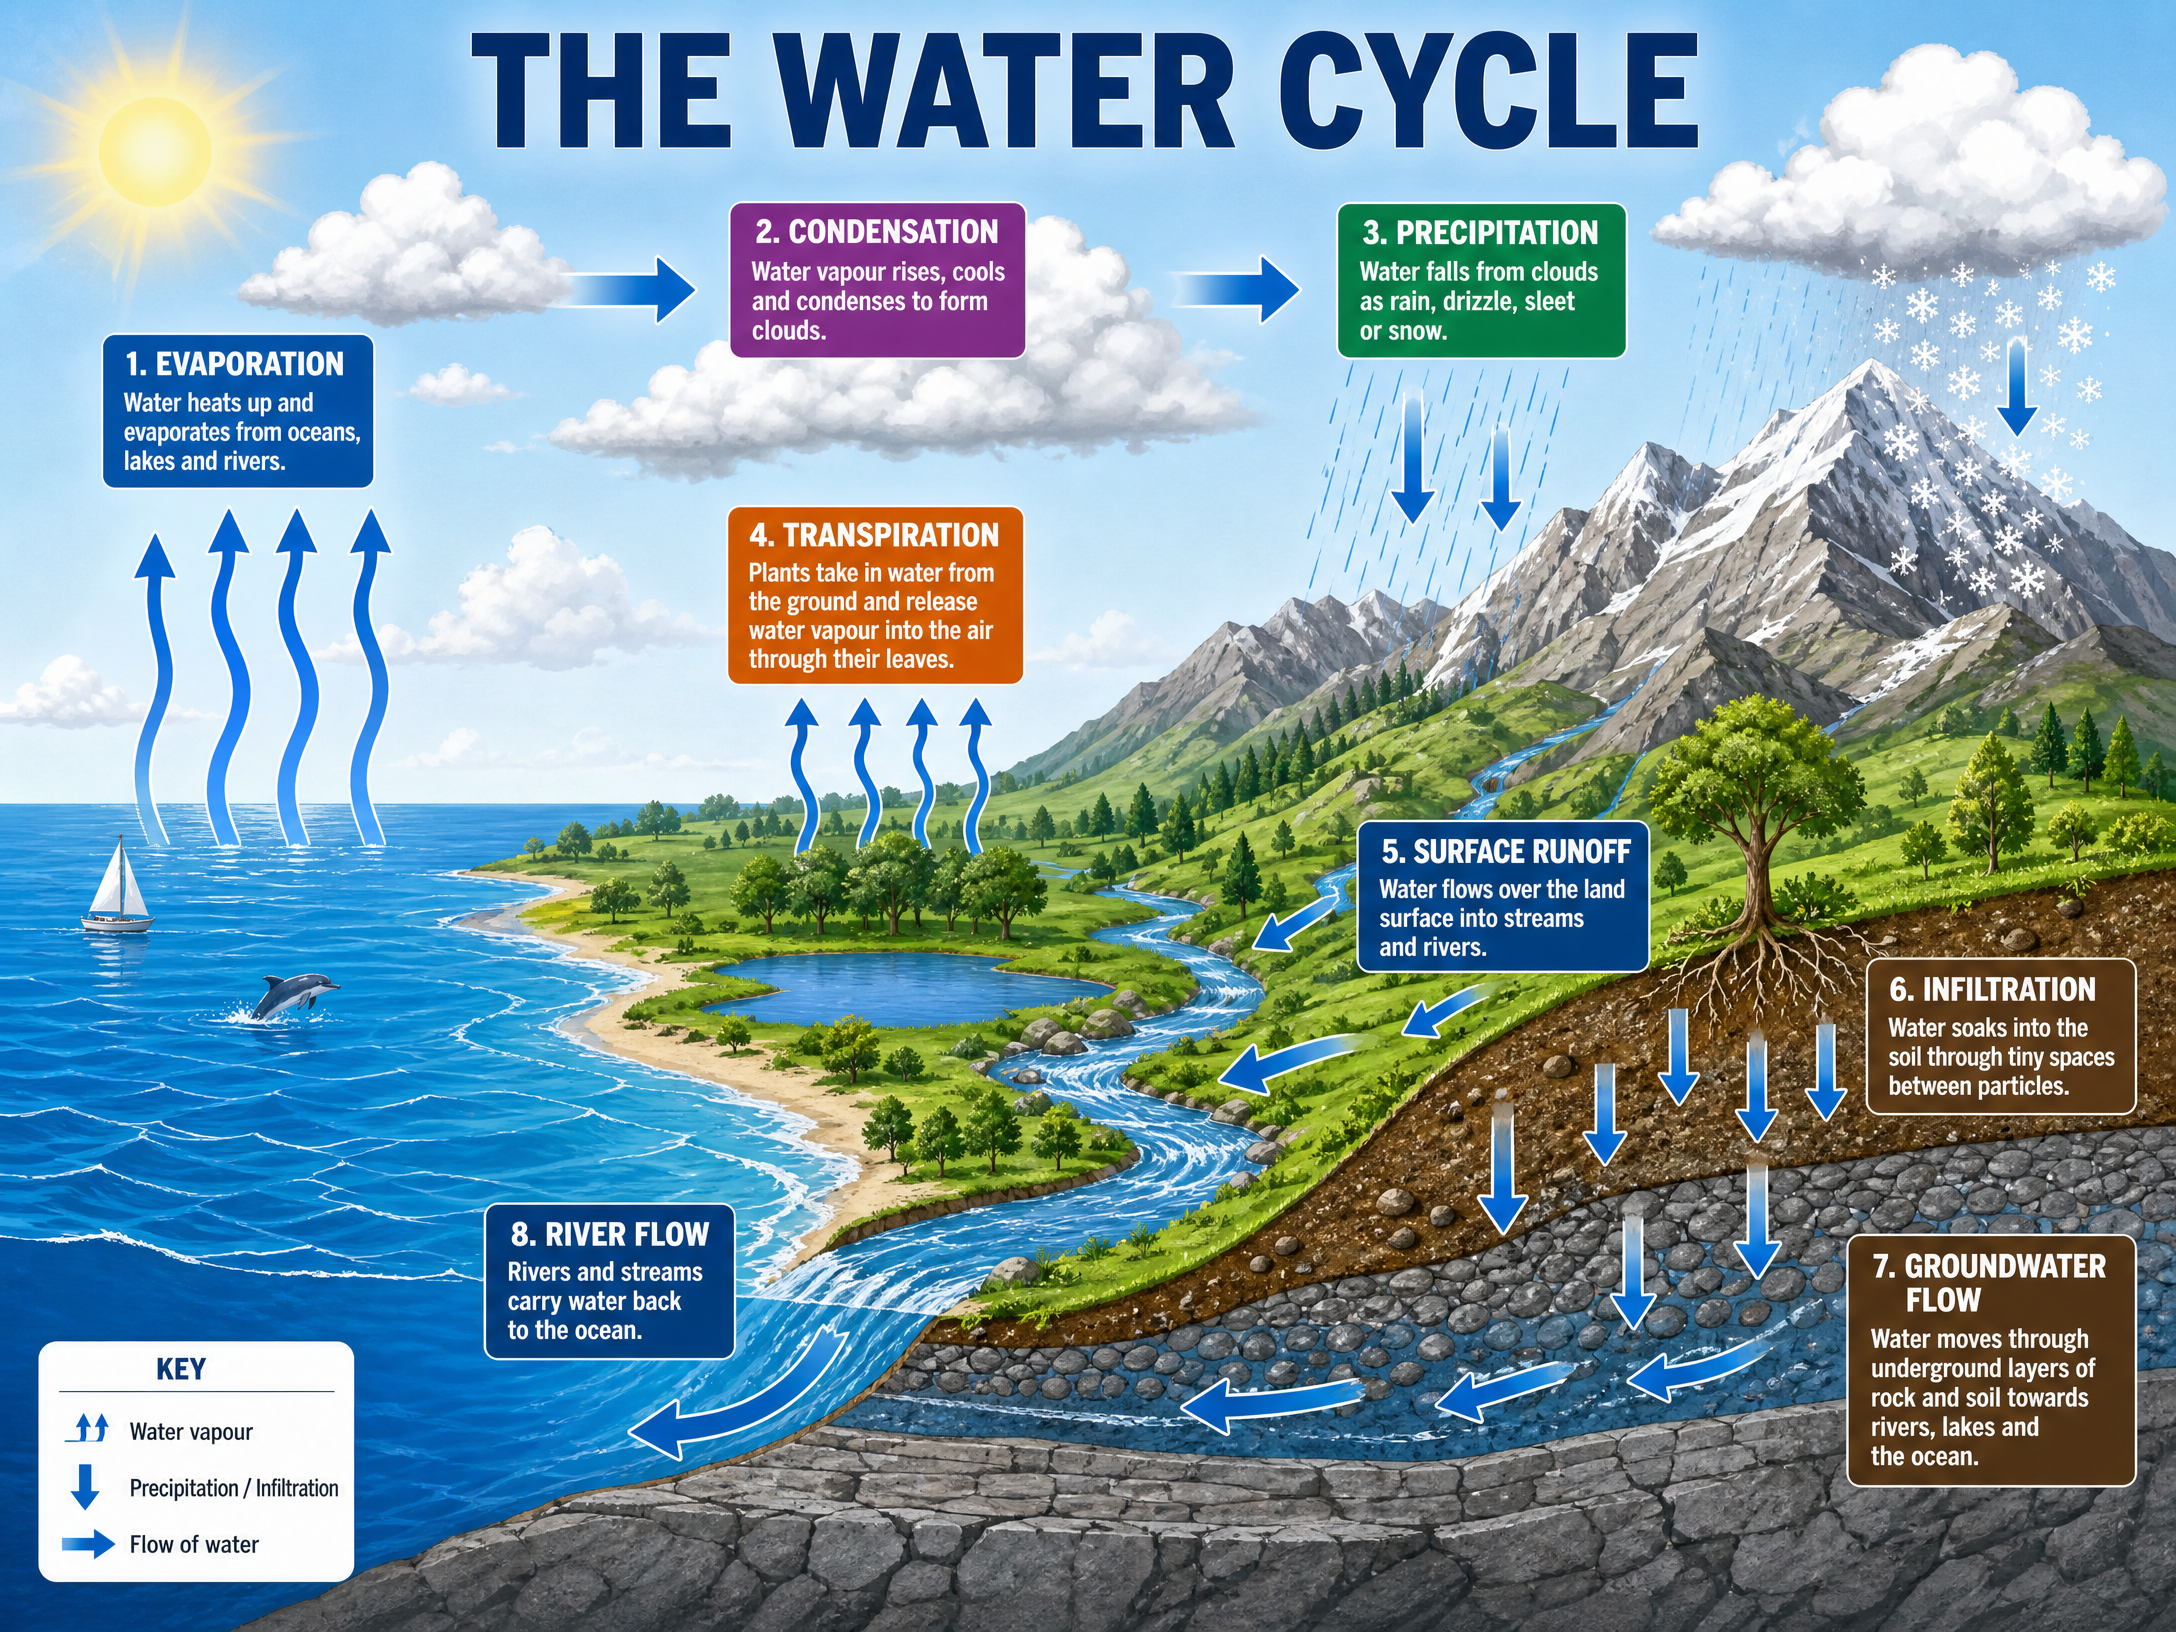
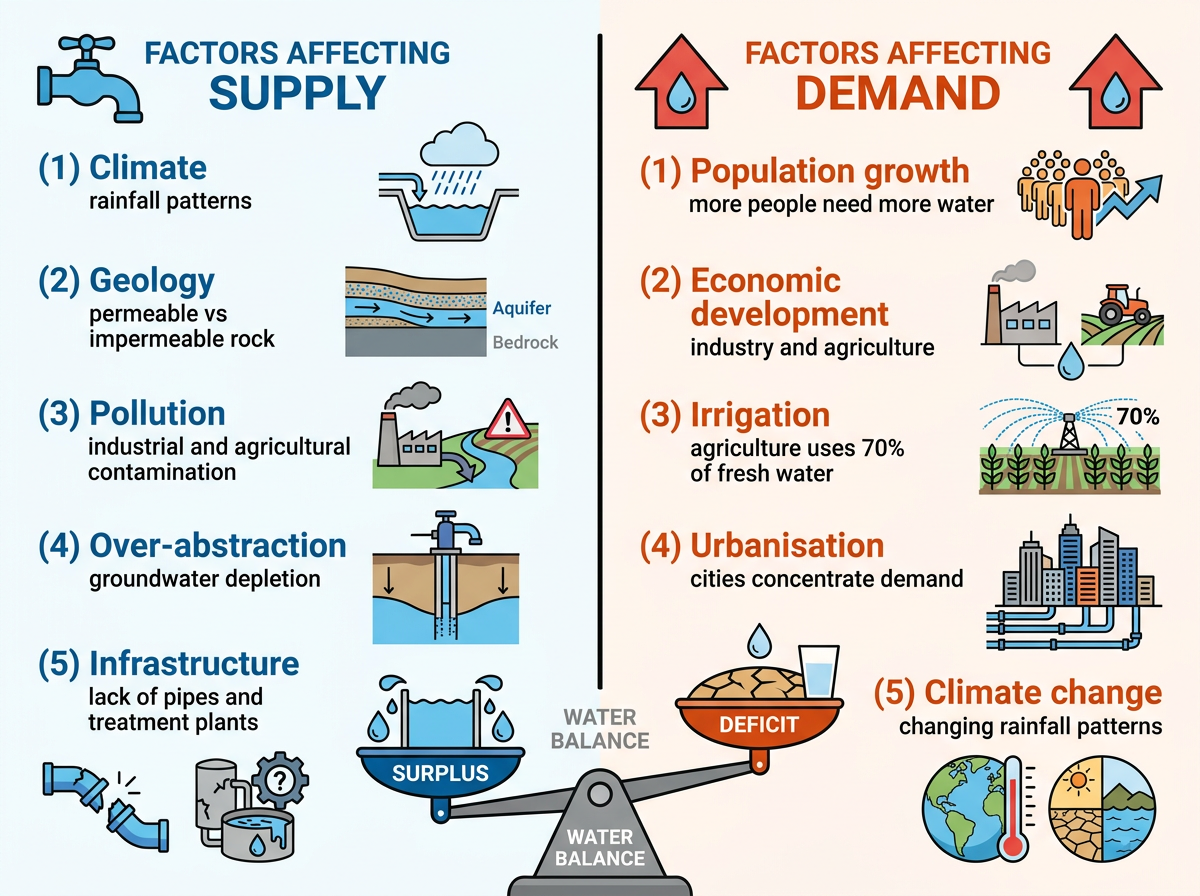
Rainfall is the primary input to the water cycle. Areas in the high-pressure subtropical belts (30° North and South) experience descending air, resulting in dry conditions and deserts. Conversely, low-pressure equatorial regions receive heavy, year-round rainfall.
Geology
The underlying rock type determines groundwater storage. Permeable rocks (like limestone and chalk) allow water to infiltrate and form underground reservoirs called aquifers. Impermeable rocks (like granite and clay) prevent infiltration, causing rapid surface runoff.
Human Factors Affecting Demand
Population Growth
The global population has more than doubled since 1970, currently exceeding 8 billion. More people require more water for drinking, sanitation, and hygiene.
Agriculture
Farming is the largest consumer of fresh water globally, accounting for approximately 70% of all water withdrawals. The increasing demand for food, particularly water-intensive crops and meat, has driven a massive expansion in irrigation.
Economic Development
As countries industrialise (e.g., China and India), water demand for manufacturing and energy production surges. Furthermore, rising living standards lead to increased domestic water use (washing machines, dishwashers, swimming pools).
Changes Over the Last 50 Years
Human intervention has significantly altered the fresh water landscape since the 1970s:
Changes in Supply
- Dam Construction: Thousands of mega-dams (e.g., the Three Gorges Dam in China) have been built to store water and regulate river flow.
- Desalination: Wealthy, water-scarce nations (e.g., Saudi Arabia, UAE) have invested heavily in removing salt from seawater, though it is energy-intensive and expensive.
- Over-abstraction: Groundwater is being pumped from aquifers faster than it can be naturally replenished (e.g., the Ogallala Aquifer in the USA).
Changes in Demand
- Virtual Water Trade: The hidden flow of water in food or other commodities traded from one place to another has increased significantly.
- Climate Change Impacts: Altered weather patterns are causing more frequent and severe droughts, increasing the demand for irrigation while simultaneously reducing supply.
Key Case Studies
The Aral Sea (Human Impact)
Once the world's fourth-largest lake, Soviet engineers diverted its feeding rivers in the 1960s to irrigate cotton fields. By 2007, it had shrunk to 10% of its original size, devastating the local fishing industry and causing severe ecological damage.
The River Nile (Geopolitics)
Egypt relies on the Nile for 97% of its fresh water. The construction of the Grand Ethiopian Renaissance Dam (GERD) upstream has caused significant geopolitical tension, illustrating how water scarcity can lead to international conflict.
Visual Resources
3 diagrams and illustrations
Interactive Diagrams
1 interactive diagram to visualise key concepts
Conceptual Flow Outline
Flowchart showing how human factors lead to water stress
Worked Examples
3 worked examples — open one to explore the question and available guidance.
Practice Questions
Test your understanding — click to reveal model answers
Using an example, explain how agriculture can cause water insecurity. (4 marks)
Hint: Think about the percentage of water agriculture uses globally, and name a specific place where this has caused a problem.
Describe the global distribution of areas with a water deficit. (3 marks)
Hint: Identify the general latitude/climate zones and name at least two specific regions or continents.
Explain how economic development increases the demand for water. (4 marks)
Hint: Think about industry, energy, and domestic lifestyle changes.
Assess the impact of human intervention on the global supply of fresh water. (9 marks)
Hint: Discuss both positive interventions (dams, desalination) and negative interventions (over-abstraction, pollution). Reach a conclusion.
Outline one reason why climate change might affect future global water supply. (2 marks)
Hint: Think about rainfall patterns or glaciers.