Pearson Edexcel · GCSE · Geography
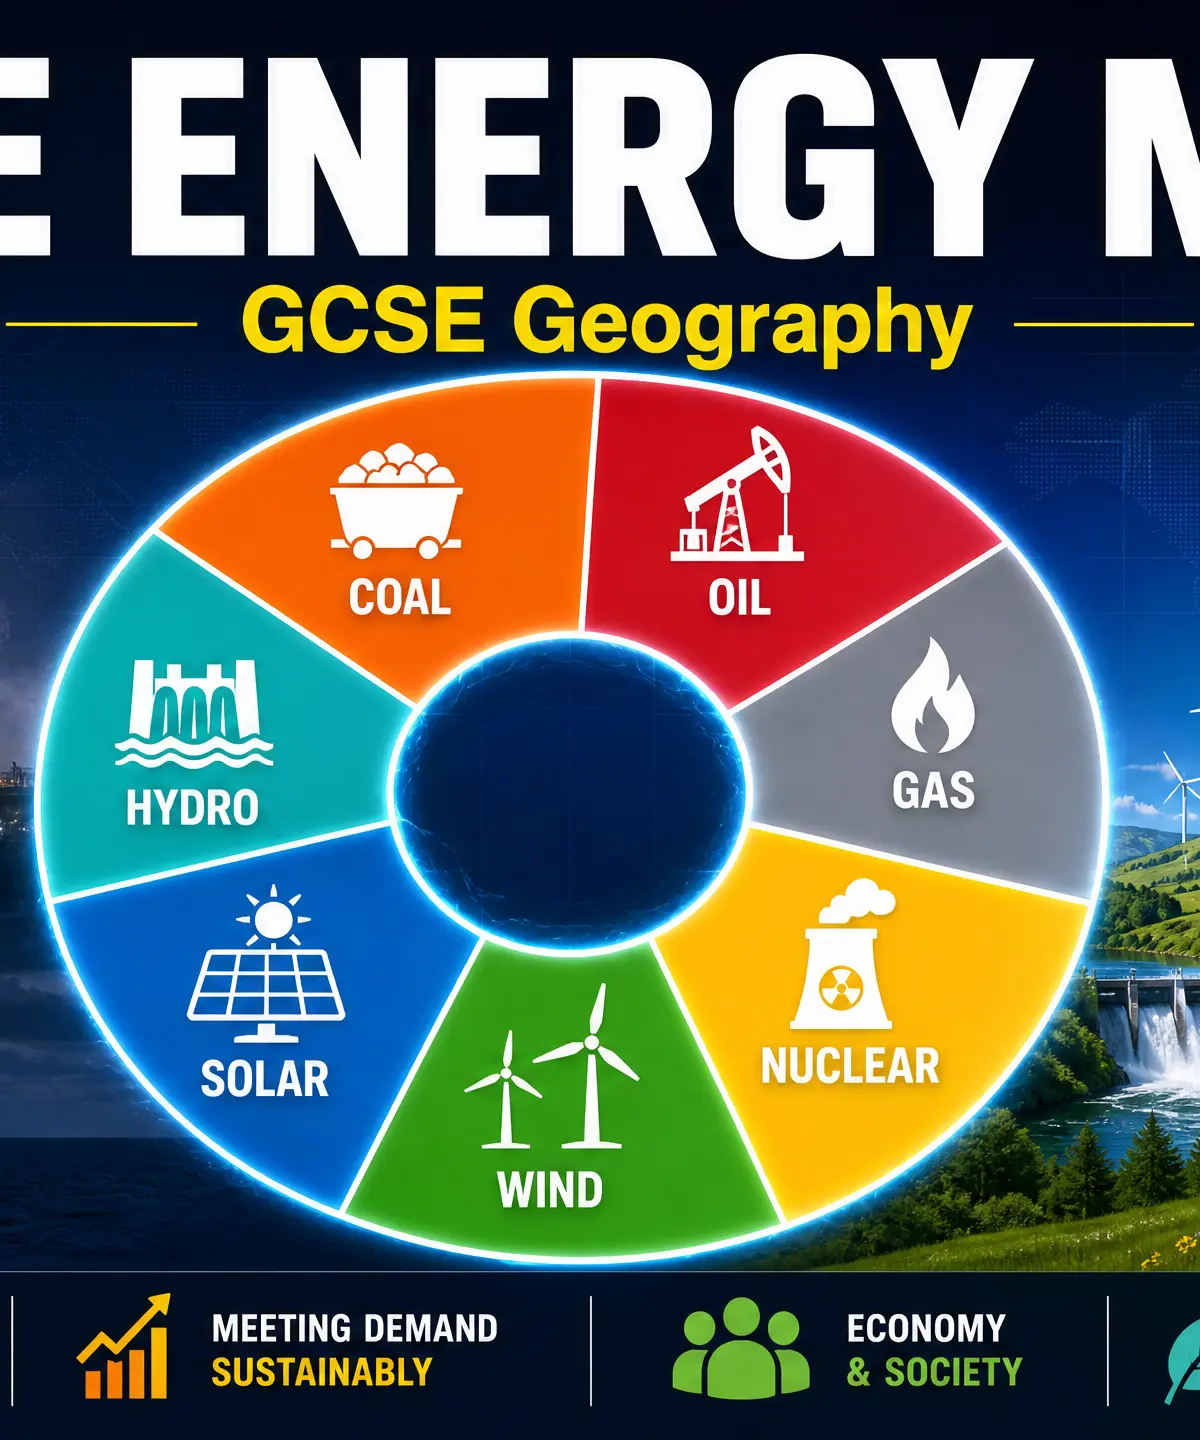
To meet demand, countries use energy resources in different proportions. This is called the energy mix
This topic explores the 'Energy Mix' — the unique recipe of energy resources each country uses to meet its demand. Understanding how population, wealth, and resource availability shape these choices is crucial for explaining global inequalities and environmental challenges.
- 5 min read
- 3 worked examples
- 5 practice questions
- 6 key terms
Study Notes
Overview
The Energy Mix refers to the different proportions of energy resources a country uses to meet its total energy demand. This is a foundational concept in human geography because it connects physical resources (what is in the ground) with human factors (population and wealth). Examiners expect candidates to clearly distinguish between 'energy demand' (how much is needed) and 'energy mix' (the percentage breakdown of sources used). Understanding why countries like the UK, Saudi Arabia, and Nigeria have vastly different energy mixes is a frequent focus of extended writing questions.
The UK's Changing Energy Mix
A Shift Away from Coal
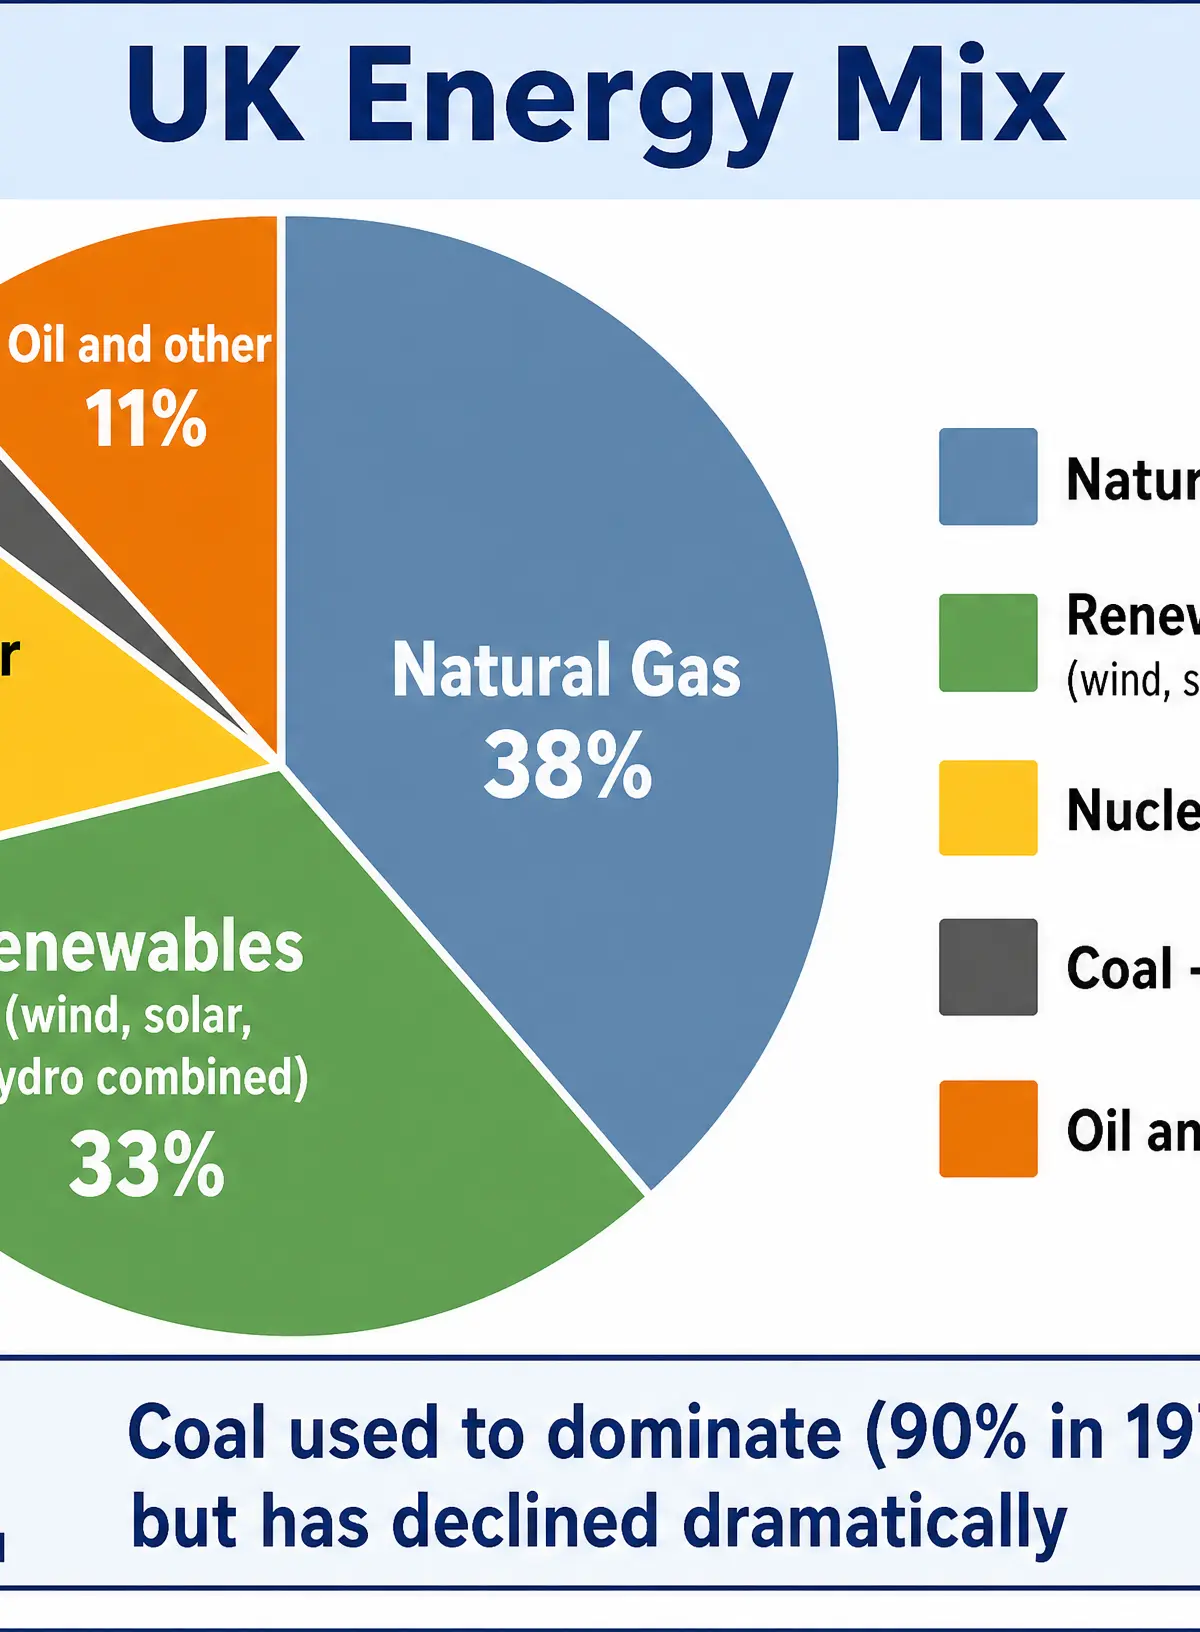
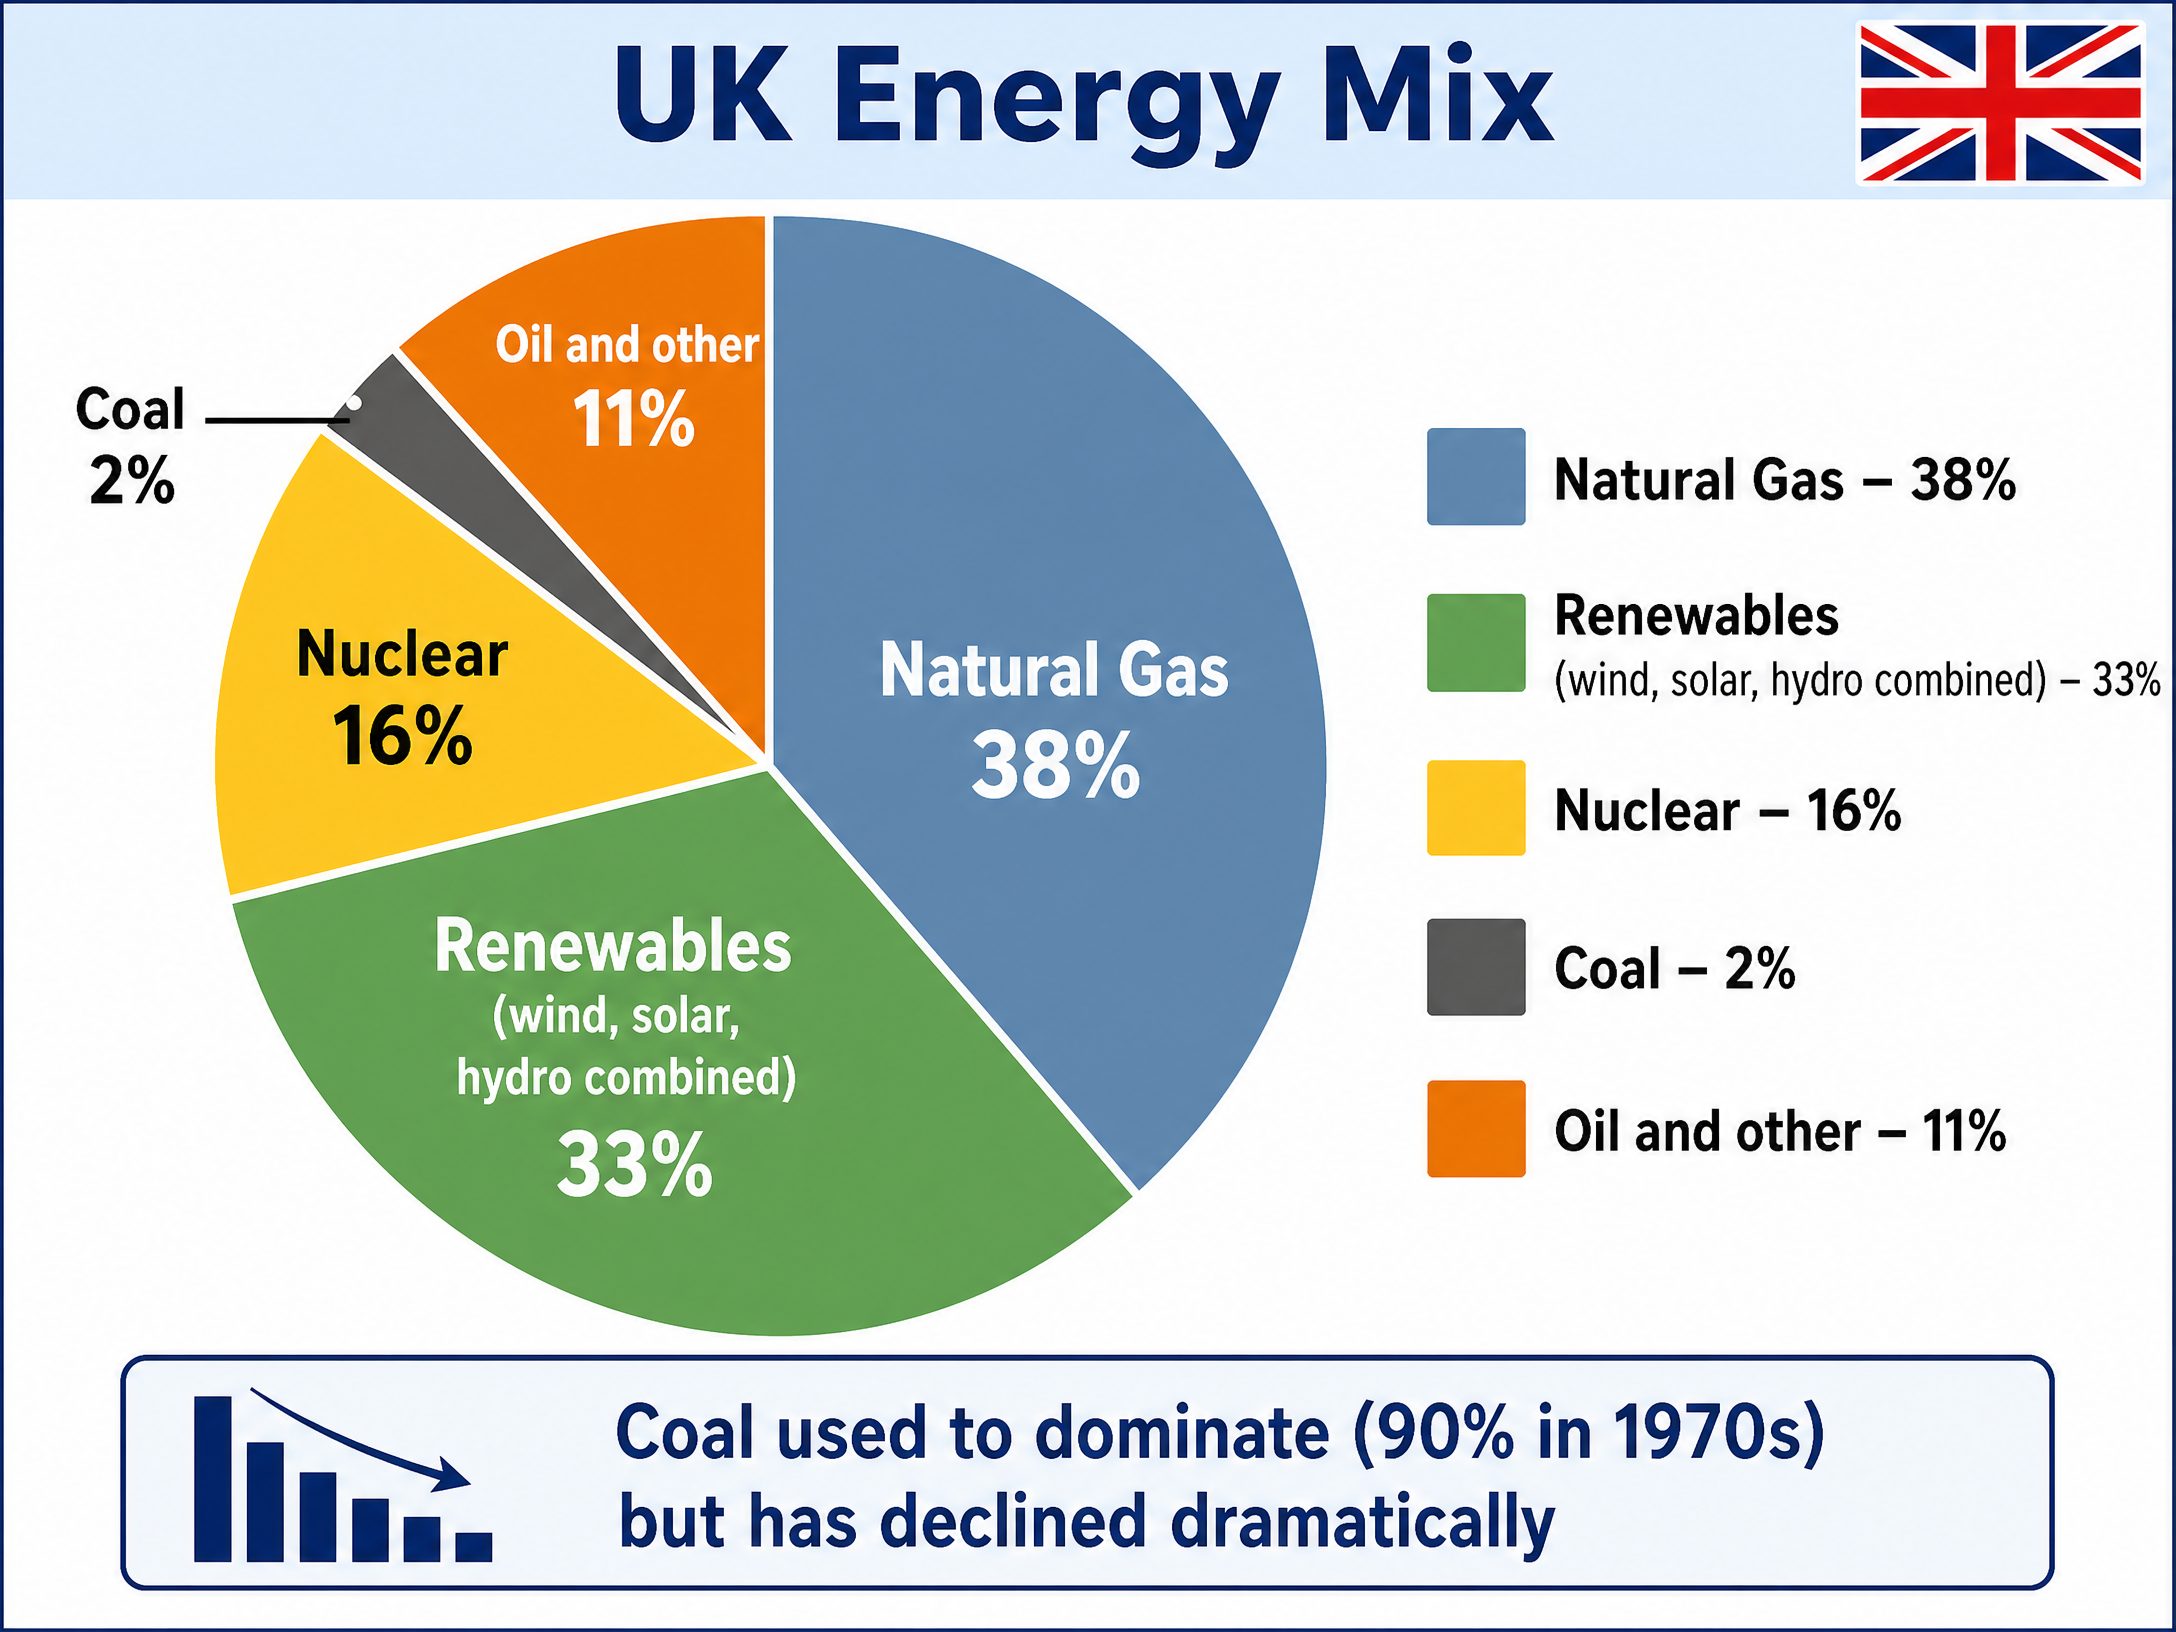
Key Trend: The UK has transitioned from a heavy reliance on coal to a diverse mix dominated by natural gas and renewables.
Specific Knowledge: In the 1970s, coal generated ~90% of UK electricity. By 2024, the UK closed its last coal-fired power station. Today, the mix is approximately 38% Natural Gas, 33% Renewables (wind, solar, hydro), 16% Nuclear, and 11% Oil/Other.
Why it matters: This demonstrates how government policy (Climate Change Act 2008) and investment can radically alter an energy mix.
Global Variations: The Three Key Factors
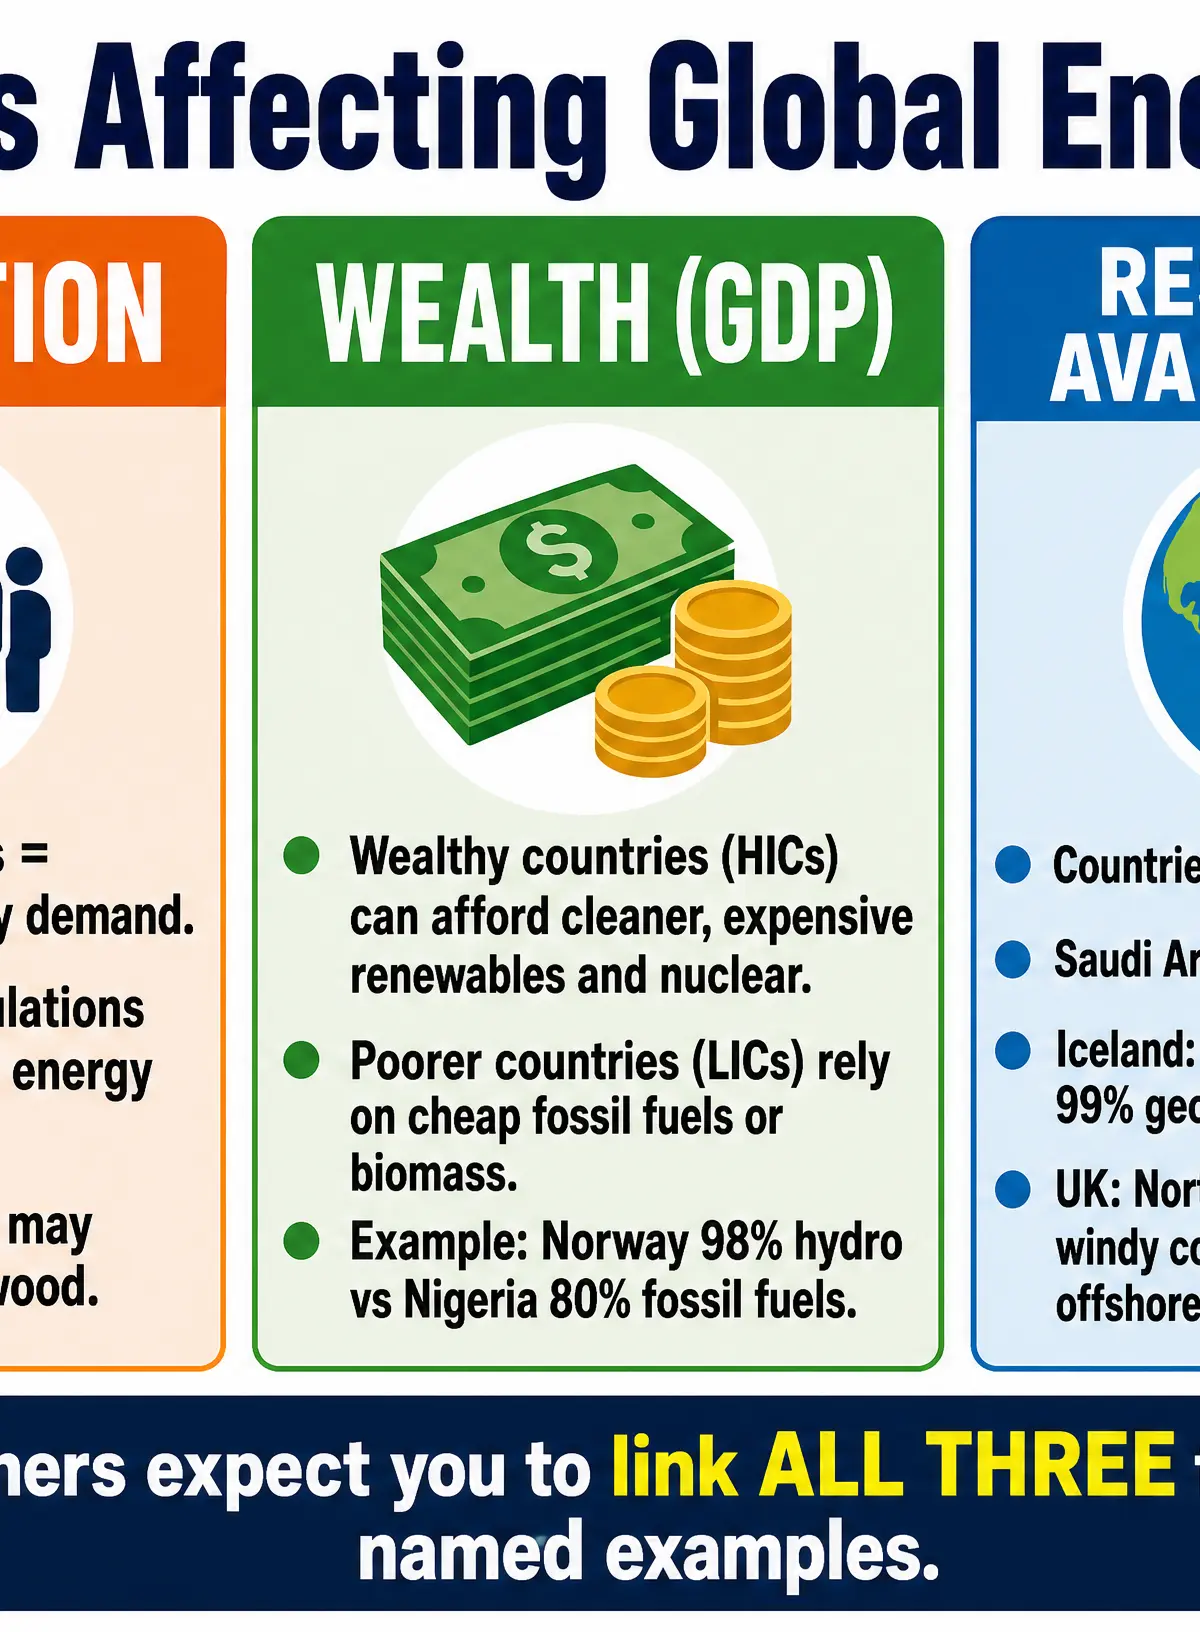
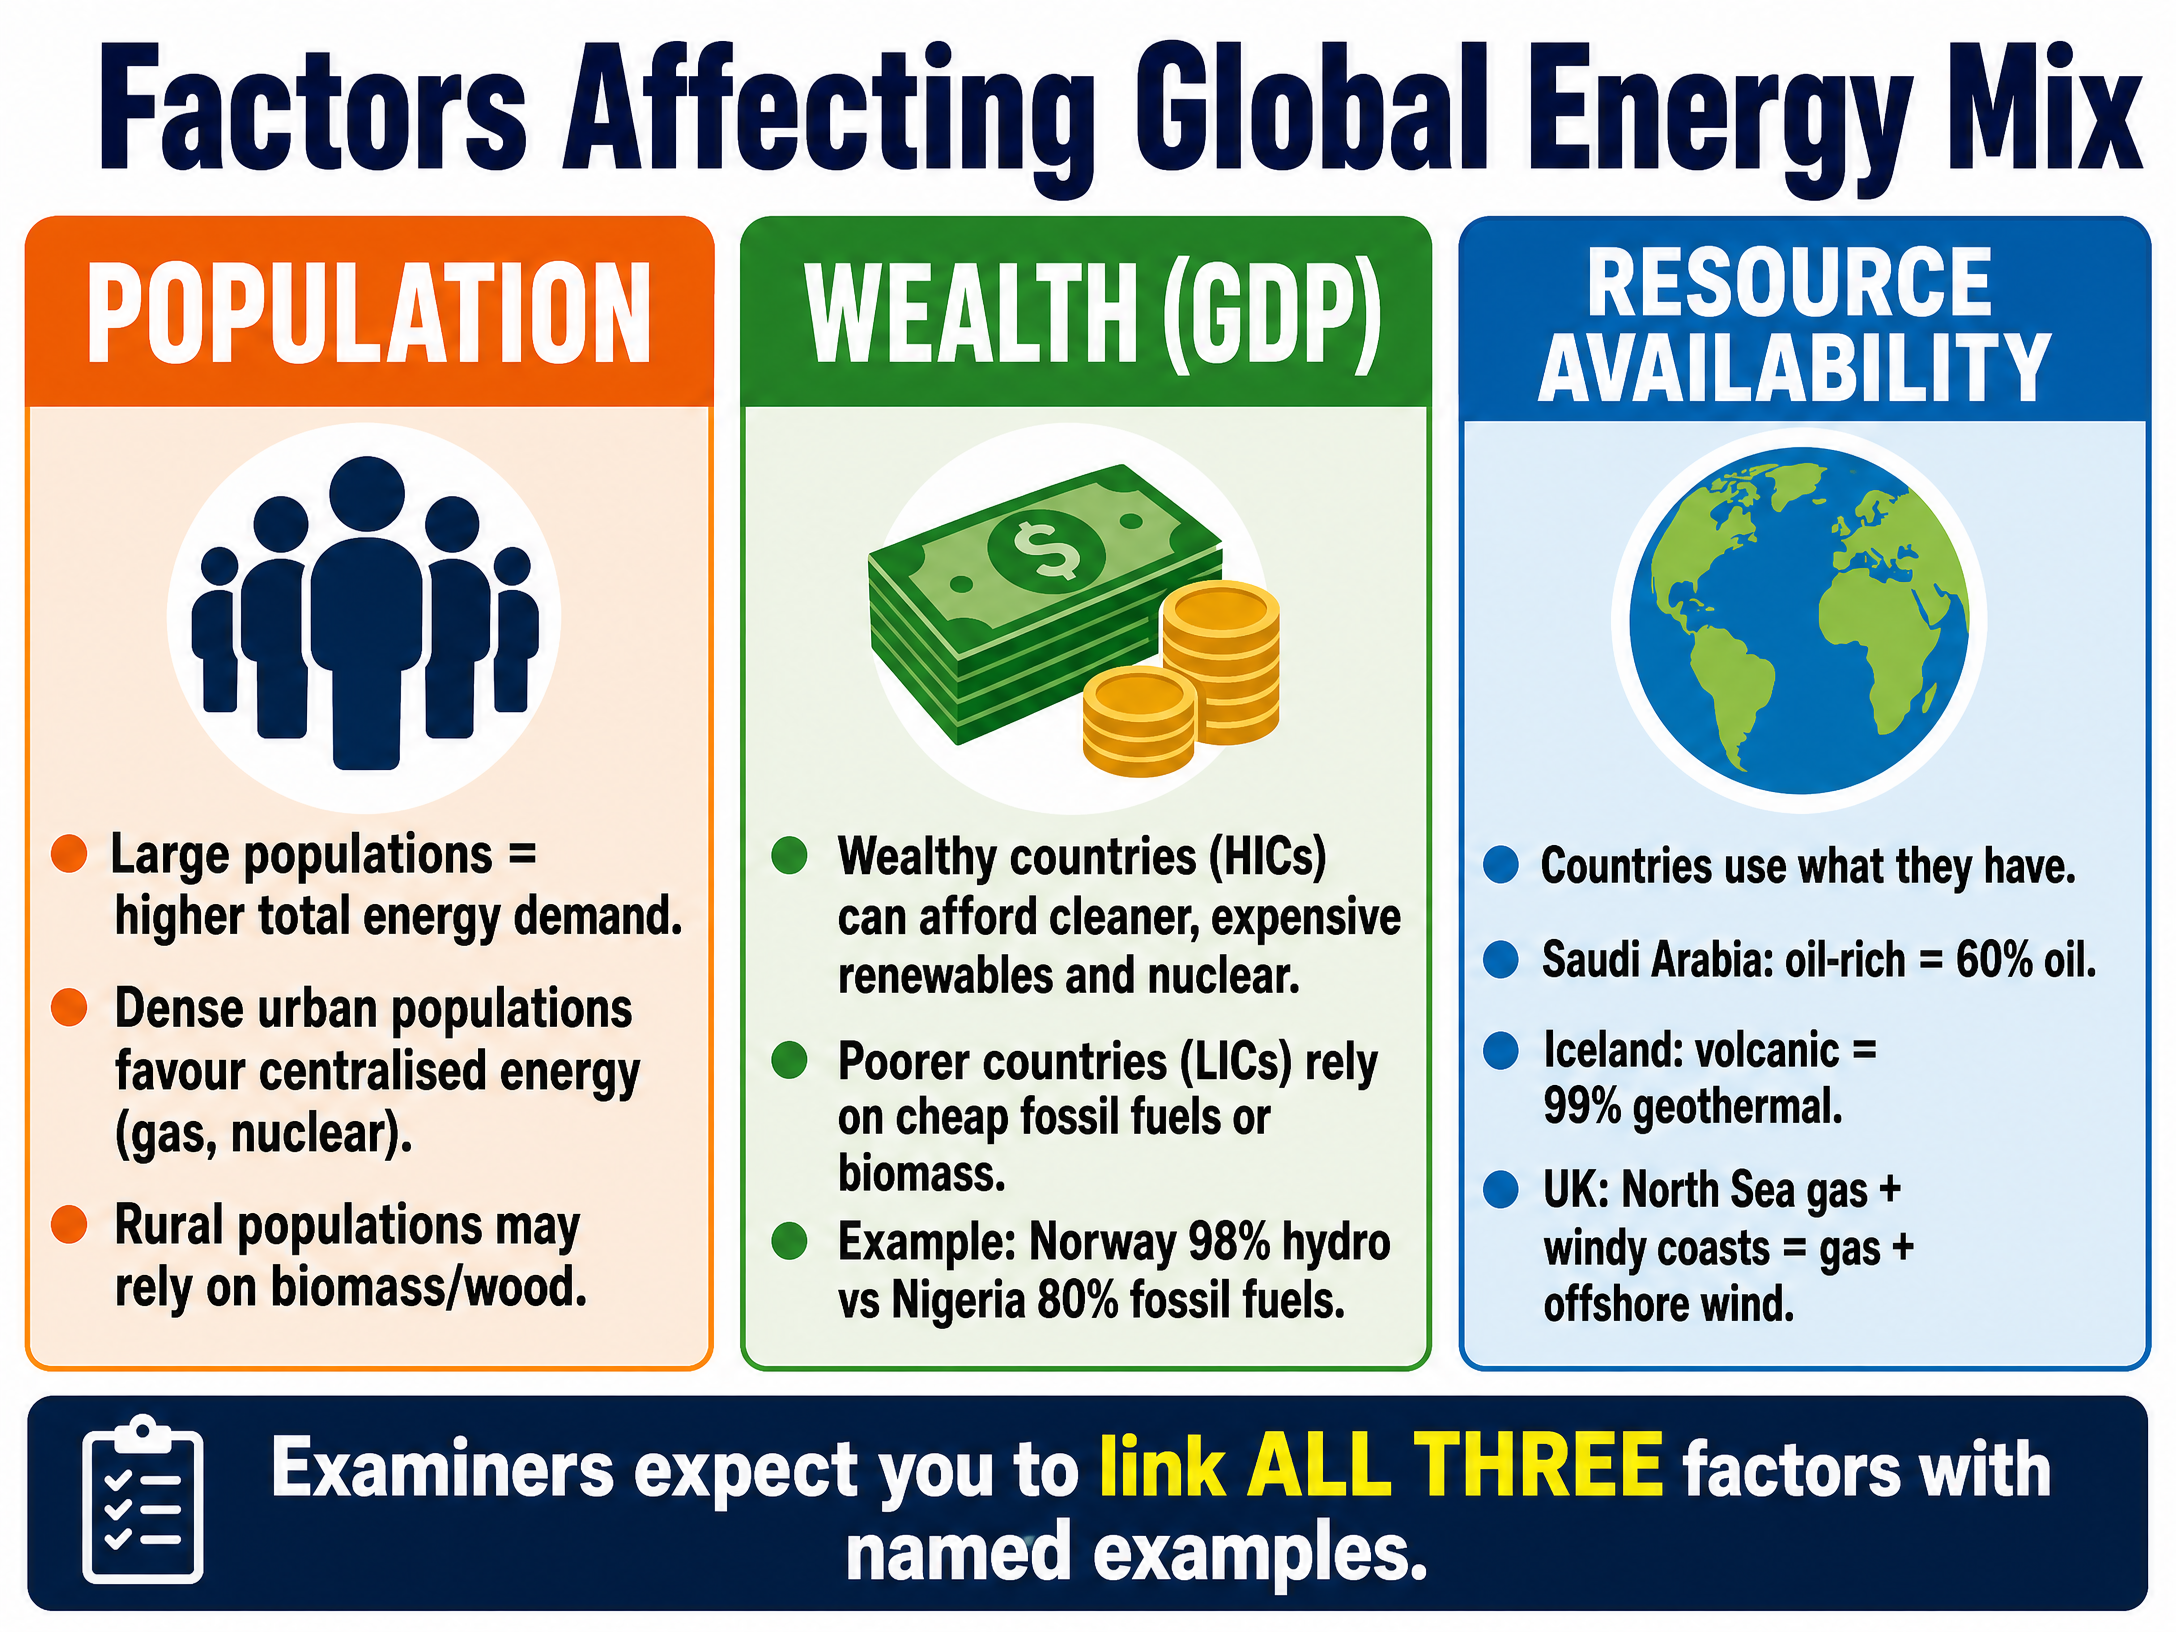
Examiners frequently ask candidates to explain global variations in the energy mix. You must link your explanations to three factors: Population, Wealth, and Resource Availability.
1. Population
Role: Affects both total demand and the type of energy used.
Key Actions: Large populations (e.g., China, 1.4 billion) drive massive energy demand, often met by cheap, scalable fossil fuels (China uses ~60% coal). Furthermore, population distribution matters: dense urban areas support centralized grids (gas/nuclear), while dispersed rural populations (e.g., in parts of Sub-Saharan Africa) often rely on biomass.
2. Wealth (GDP)
Role: Determines a country's ability to invest in energy infrastructure.
Key Actions: High Income Countries (HICs) like the UK and Denmark can afford the high capital costs of renewable technology (offshore wind) and nuclear power. Low Income Countries (LICs) like Nigeria (GDP per capita ~$2,100) often lack capital for infrastructure and rely on cheaper fossil fuels or traditional biomass.
3. Availability of Energy Resources
Role: Countries naturally exploit their domestic resources to ensure energy security and reduce import costs.
Key Actions: Physical geography dictates options. Saudi Arabia sits on vast oil reserves, so oil dominates its mix. Iceland sits on a tectonic plate boundary, allowing it to generate ~66% of its electricity from geothermal sources.
Case Studies: Comparing Energy Mixes
Saudi Arabia
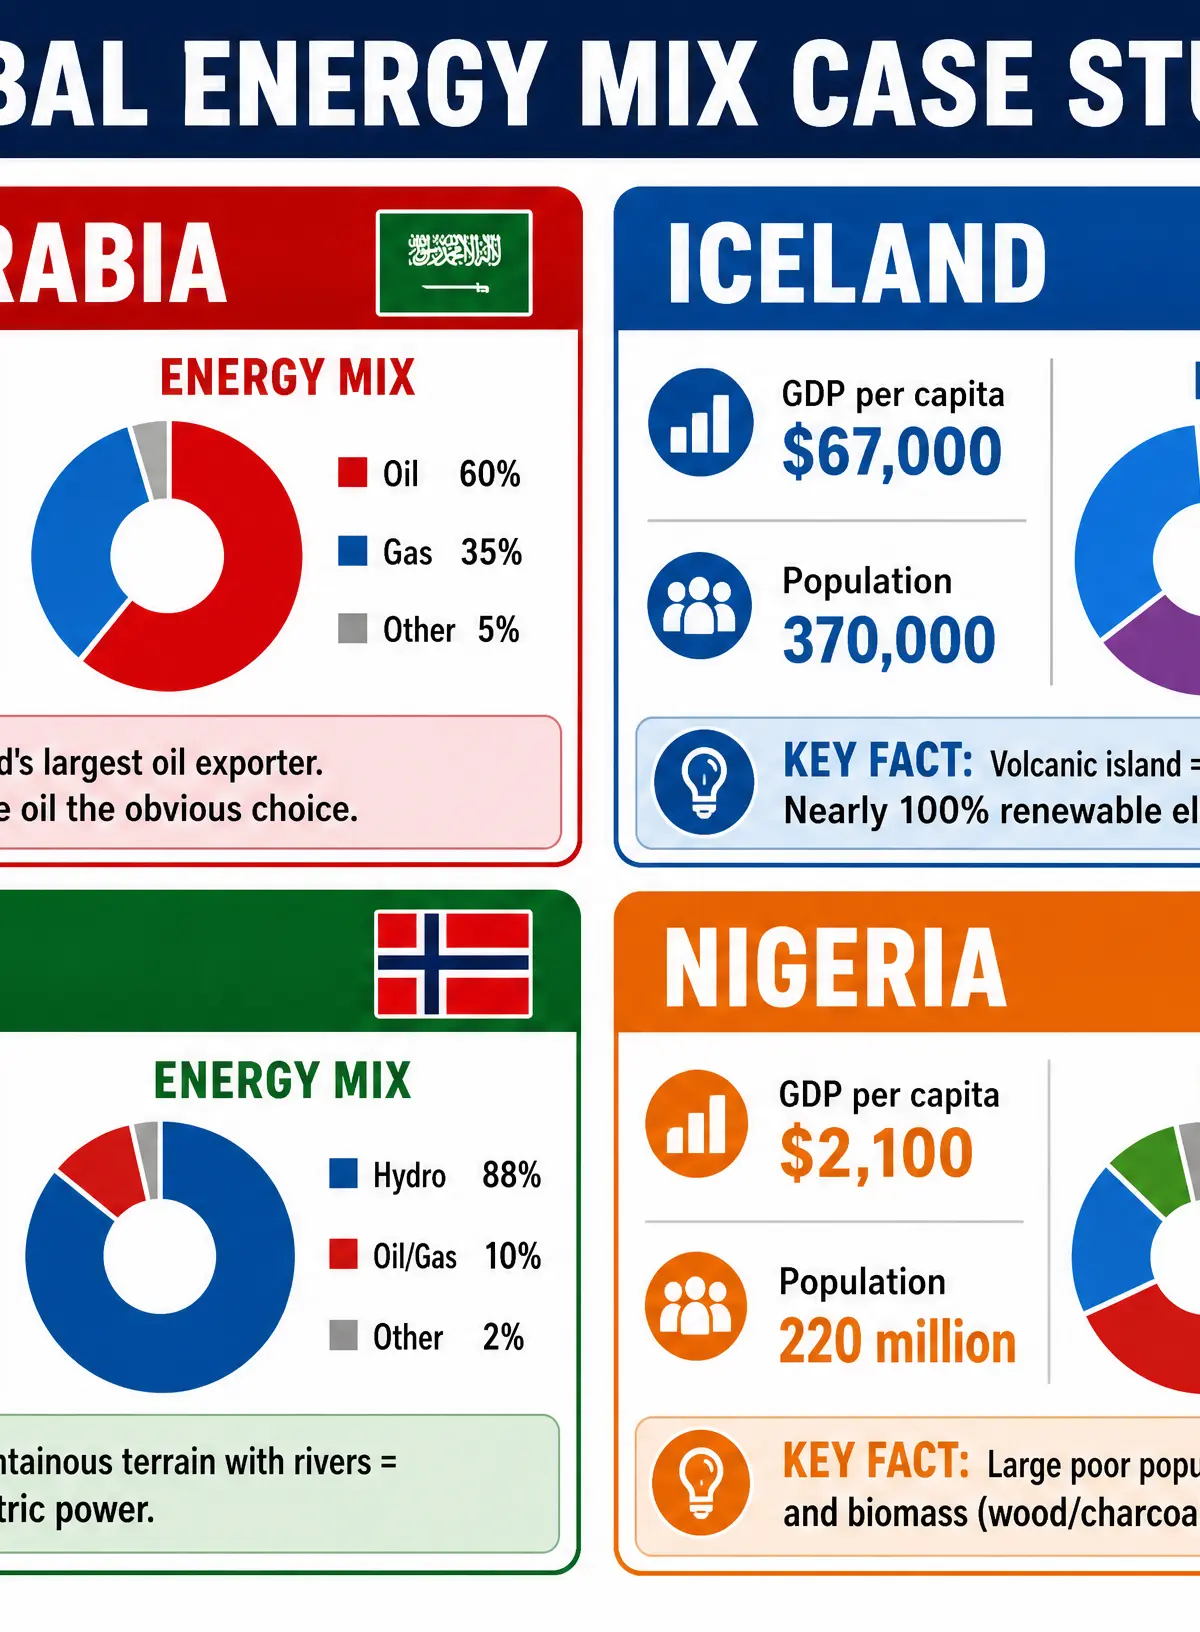
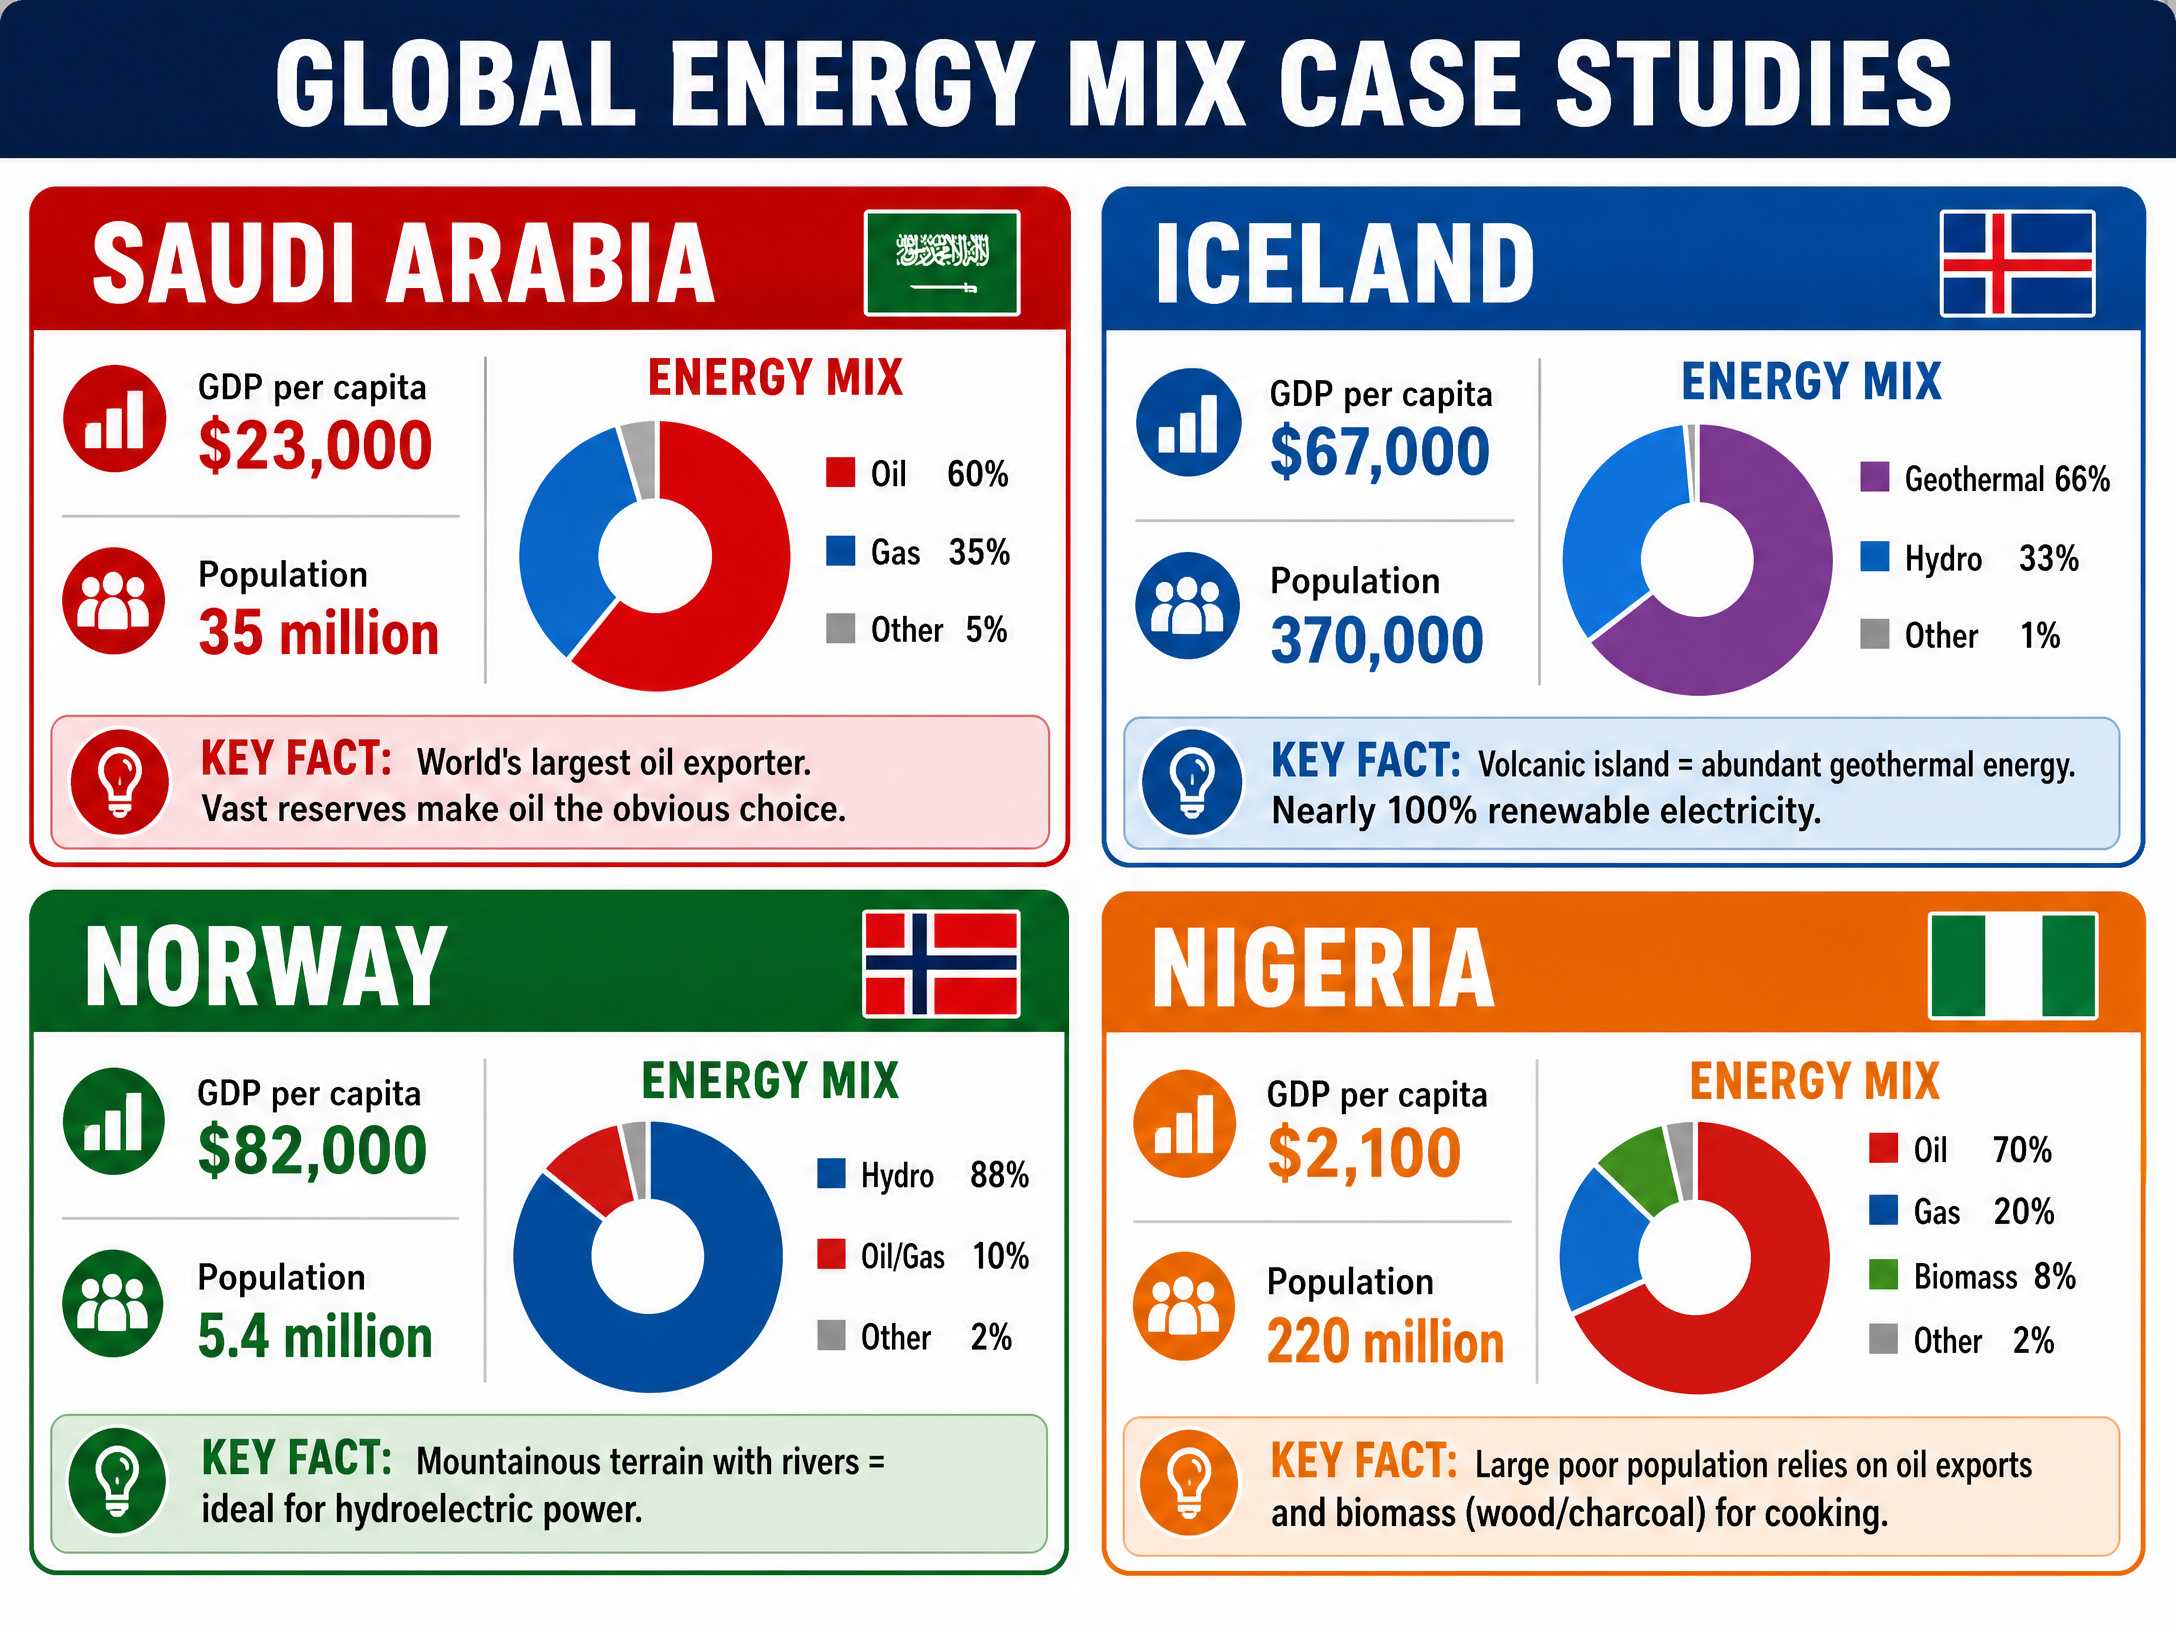
Mix: ~60% Oil, ~35% Gas
Explanation: World's largest oil exporter. Abundant domestic reserves make fossil fuels the most logical and economic choice.
Iceland
Mix: ~66% Geothermal, ~33% Hydroelectric
Explanation: Volcanic geology (Mid-Atlantic Ridge) provides geothermal heat; mountainous terrain provides hydro. Nearly 100% renewable.
Norway
Mix: ~88% Hydroelectric
Explanation: Mountainous topography with high rainfall and steep valleys makes it ideal for large-scale hydroelectric dams.
Nigeria
Mix: ~70% Oil, ~20% Gas, ~8% Biomass
Explanation: Despite exporting oil, lack of wealth and infrastructure means many rural populations rely on burning wood (biomass) for domestic energy.
Listen to the Revision Podcast
Consolidate your knowledge by listening to our 15-minute deep dive into the Energy Mix, featuring examiner tips and a quick-fire quiz.

Second-Order Concepts
Causation
Why do energy mixes change? Causes include physical factors (discovery of North Sea gas), economic factors (cost of renewables falling), and political factors (carbon reduction targets).
Change & Continuity
While HICs are rapidly changing their energy mixes towards renewables, many LICs show continuity in their reliance on traditional biomass and fossil fuels due to economic constraints.
Significance
A country's energy mix is significant because it directly impacts its carbon footprint, economic development, and energy security (vulnerability to global price shocks).
Visual Resources
3 diagrams and illustrations
Interactive Diagrams
2 interactive diagrams to visualise key concepts
Diagram could not be rendered
Approximate UK Energy Mix showing the dominance of Gas and Renewables.
Conceptual Flow Outline
The P-W-R factors affecting global energy mix variations.
Worked Examples
3 worked examples — open one to explore the question and available guidance.
Practice Questions
Test your understanding — click to reveal model answers
Using an example, explain how the availability of energy resources affects a country's energy mix. (4 marks)
Hint: Name a specific country, state its main resource, and give a percentage.
State two reasons why the proportion of coal in the UK's energy mix has declined. (2 marks)
Hint: Think about government laws and alternative cheaper resources.
Explain how population distribution can influence a country's energy mix. (4 marks)
Hint: Contrast dense urban populations with remote rural populations in LICs.
To what extent do you agree that wealth is the most important factor in changing a country's energy mix? (9 marks)
Hint: Argue that wealth allows change (e.g., UK investing in wind), but physical resources often dictate the starting point.
Describe the relationship between a country's GDP and its use of biomass in its energy mix. (3 marks)
Hint: Is it a positive or negative correlation? Give an example.