OCR · A-Level · Psychology
Course version: H567 · Version from Sept 2015
Construct and interpret frequency tables and diagrams, bar charts and…
Full specification wording
D.1 – handling data: Construct and interpret frequency tables and diagrams, bar charts and histograms (to include: selecting and sketching an appropriate form of data display for a given set of data)
A frequency table organises raw data into counts per category or class interval, dictating the appropriate graph.
- Point 3 of 17
- 3 key terms
Study notes
From the teaching notes for this specification point.
The idea
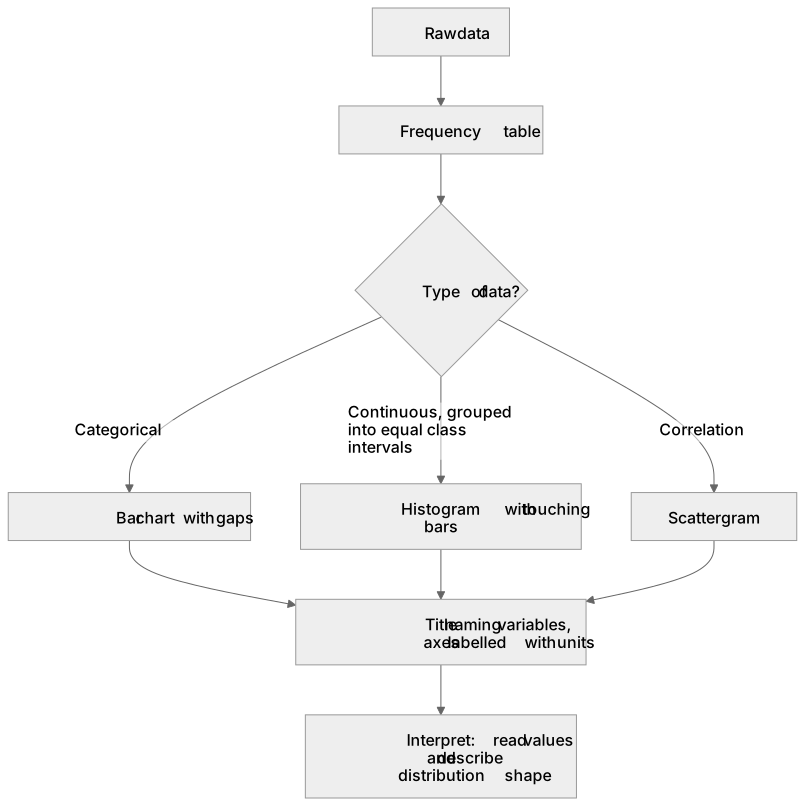
A frequency table organises raw data into counts per category or class interval, dictating the appropriate graph. Categorical data (e.g., number of participants conforming) requires a bar chart with gaps between bars, representing discrete categories. Continuous data grouped into equal class intervals requires a histogram, featuring touching bars and a continuous numerical scale on the x-axis, where area represents frequency. A correlation requires a scattergram. When sketching any display, both axes must have labels and units, and the title should clearly name the variables. Interpreting these diagrams involves reading values accurately and describing the distribution's shape.
What earns the marks
- Justify the choice of display based on the data type: a bar chart for categorical data, a histogram for continuous data, and a scattergram for correlations.
- Construct a histogram with touching bars and equal class intervals to represent continuous data accurately.
- Sketch a bar chart with equal gaps between bars of equal width to represent discrete, categorical data.
- Earn sketch marks by providing a descriptive title naming both variables, labelling both axes with units, and plotting data to the correct heights.
- Interpret a frequency diagram by accurately reading values from the axes and explaining what the distribution shape indicates about the dataset.
Common mistakes and how to put them right
Drawing a histogram for categorical data or leaving gaps between bars in a histogram, demonstrating confusion between discrete and continuous data.
Plotting each participant's individual score as a separate bar rather than grouping data into frequencies, resulting in a chart that shows no overall pattern.
Omitting axis labels or starting the vertical scale above zero without a break symbol, which can visually exaggerate minor differences between conditions.
Exam tips
- Before drawing any bars or points, write a full title and label both axes with appropriate units to secure foundational presentation marks.
- If presented with ungrouped continuous data, state that you would first organise it into a frequency table with equal class intervals before sketching a histogram.
Try the lesson
The start of the D.1 – handling data: Construct and interpret frequency tables and diagrams, bar charts and histograms (to include: selecting and sketching an appropriate form of data display for a given set of data) lesson, made from teaching notes for this specification point.
Have a go first
A psychologist collects data on the favourite colours of 50 children in a nursery. Which form of data display is most appropriate for this set of data?
Listen
A frequency table organises raw data into counts per category or class interval, dictating the appropriate graph. Categorical data (e.g., number of participants conforming) requires a bar chart with gaps between bars, representing discrete categories. Continuous data grouped into equal class intervals requires a histogram, featuring touching bars and a continuous numerical scale on the x-axis, where area represents frequency. A correlation requires a scattergram. When sketching any display, both axes must have labels and units, and the title should clearly name the variables. Interpreting these diagrams involves reading values accurately and describing the distribution's shape. A strong answer earns marks for these points. Justify the choice of display based on the data type: a bar chart for categorical data, a histogram for continuous data, and a scattergram for correlations. Construct a histogram with touching bars and equal class intervals to represent continuous data accurately. Sketch a bar chart with equal gaps between bars of equal width to represent discrete, categorical data. Earn sketch marks by providing a descriptive title naming both variables, labelling both axes with units, and plotting data to the correct heights. Exam tip: Before drawing any bars or points, write a full title and label both axes with appropriate units to secure foundational presentation marks.
See it
Key words
Say what each word means before you turn the card.
frequency tables
Try answering aloud or in your head before turning the card.
bar charts and histograms
Try answering aloud or in your head before turning the card.
data display selection
Try answering aloud or in your head before turning the card.
See every definition
- frequency tables
- A way of organising raw data into counts per category or class interval, which dictates the appropriate graph.
- bar charts and histograms
- A bar chart with gaps between bars represents discrete categories, while a histogram with touching bars and equal class intervals represents continuous data.
- data display selection
- Choosing an appropriate form of data display based on the data type: a bar chart for categorical data, a histogram for continuous data, and a scattergram for correlations.
Label the diagram
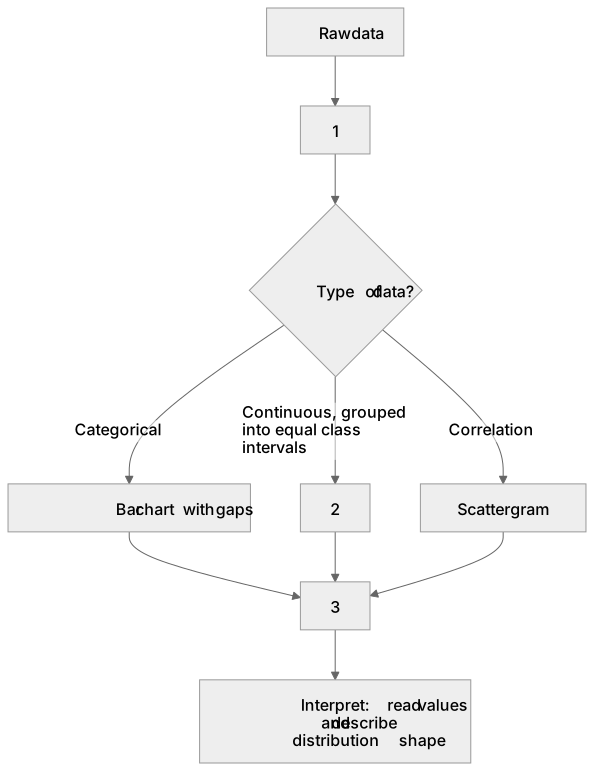
Some boxes have lost their names. Pick the right name for each number.
1Box 1
2Box 2
3Box 3
There is more to this lesson
The full lesson goes on to check your understanding and help you earn the marks. Create a free account to carry on, with your progress saved.
A week of Premium from your first lesson · Then the free plan continues · No card, no charge
Test your understanding of D.1 – handling data: Construct and interpret frequency tables and diagrams, bar charts and histograms (to include: selecting and sketching an appropriate form of data display for a given set of data)
Active recall beats re-reading. Take an instant quiz now to test what you’ve learned and lock it into long-term memory.
A week of Premium from your first lesson · Then the free plan continues · No card, no charge