OCR · A-Level · Psychology
Course version: H567 · Version from Sept 2015
Understand simple probability (to include: explaining the difference…
Full specification wording
D.1 – handling data: Understand simple probability (to include: explaining the difference between the 0.05 and 0.01 levels of significance)
A probability value (p) represents the chance of obtaining a result at least as extreme as the one found, assuming the null hypothesis is true.
- Point 4 of 17
- 4 key terms
Study notes
From the teaching notes for this specification point.
The idea
A probability value (p) represents the chance of obtaining a result at least as extreme as the one found, assuming the null hypothesis is true. The significance level (alpha) is the preset threshold used to decide if this p-value is small enough to reject the null hypothesis. Psychology conventionally accepts a result as significant when the p-value is less than or equal to the 0.05 (5%) significance level. A stricter level of 0.01 (1%) is chosen when a false claim would be costly, such as in drug trials. Lowering the significance level reduces the risk of a Type I error (rejecting a true null hypothesis) but increases the risk of a Type II error (retaining a false null hypothesis). The 0.05 level serves as a conventional compromise between these two errors.
What earns the marks
- Define the significance level accurately as the preset threshold (e.g., 0.05) at which the null hypothesis is rejected, distinguishing it from the calculated p-value.
- Explain the trade-off: the stricter 0.01 level reduces the chance of a Type I error (false positive) but makes a genuine effect harder to detect, increasing Type II errors.
- Name Type I and Type II errors accurately, linking them to the choice between 0.05 and 0.01 levels.
- Justify the chosen level from the context, for example, selecting 0.01 when patients would receive a new therapy based on the findings.
Common mistakes and how to put them right
Conflating the significance level (the preset threshold) with the p-value (the calculated probability of the observed data given the null hypothesis).
Claiming the stricter level is always better, without recognising that it raises the chance of missing a real effect (Type II error).
Writing the inequality the wrong way round, stating a result is significant when the calculated probability is larger than the stated level (e.g., p > 0.05).
Exam tips
- Questions often ask why a researcher chose one level rather than the other, so answer with the consequence of making a Type I or Type II error in that specific study.
- Keep wording precise in discussion answers; avoid stating that a significant result 'proves' the experimental hypothesis or that results are 'due to chance'.
Try the lesson
The start of the D.1 – handling data: Understand simple probability (to include: explaining the difference between the 0.05 and 0.01 levels of significance) lesson, made from teaching notes for this specification point.
Have a go first
A psychologist analyses their data and finds the results are significant at the 0.05 level. What does this level of significance indicate about the results?
Listen
A probability value (p) represents the chance of obtaining a result at least as extreme as the one found, assuming the null hypothesis is true. The significance level (alpha) is the preset threshold used to decide if this p-value is small enough to reject the null hypothesis. Psychology conventionally accepts a result as significant when the p-value is less than or equal to the 0.05 (5%) significance level. A stricter level of 0.01 (1%) is chosen when a false claim would be costly, such as in drug trials. Lowering the significance level reduces the risk of a Type I error (rejecting a true null hypothesis) but increases the risk of a Type II error (retaining a false null hypothesis). The 0.05 level serves as a conventional compromise between these two errors. A strong answer earns marks for these points. Define the significance level accurately as the preset threshold (e.g., 0.05) at which the null hypothesis is rejected, distinguishing it from the calculated p-value. Explain the trade-off: the stricter 0.01 level reduces the chance of a Type I error (false positive) but makes a genuine effect harder to detect, increasing Type II errors. Name Type I and Type II errors accurately, linking them to the choice between 0.05 and 0.01 levels. Justify the chosen level from the context, for example, selecting 0.01 when patients would receive a new therapy based on the findings. Exam tip: Questions often ask why a researcher chose one level rather than the other, so answer with the consequence of making a Type I or Type II error in that specific study.
See it
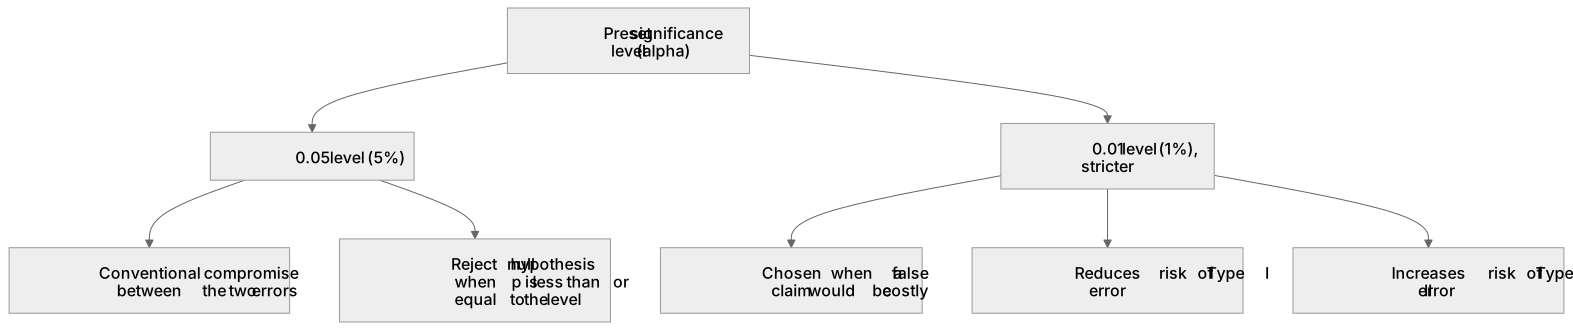
Key words
Say what each word means before you turn the card.
levels of significance
Try answering aloud or in your head before turning the card.
null hypothesis
Try answering aloud or in your head before turning the card.
Type I error
Try answering aloud or in your head before turning the card.
Type II error
Try answering aloud or in your head before turning the card.
See every definition
- levels of significance
- Preset thresholds, such as 0.05 and 0.01, used to decide whether a calculated probability is small enough to reject the null hypothesis.
- null hypothesis
- The assumption that is held to be true when a probability value is calculated, and which is rejected when the p-value is small enough.
- Type I error
- Rejecting a true null hypothesis, a risk reduced by lowering the significance level.
- Type II error
- Retaining a false null hypothesis, a risk increased by lowering the significance level.
Label the diagram
Some boxes have lost their names. Pick the right name for each number.
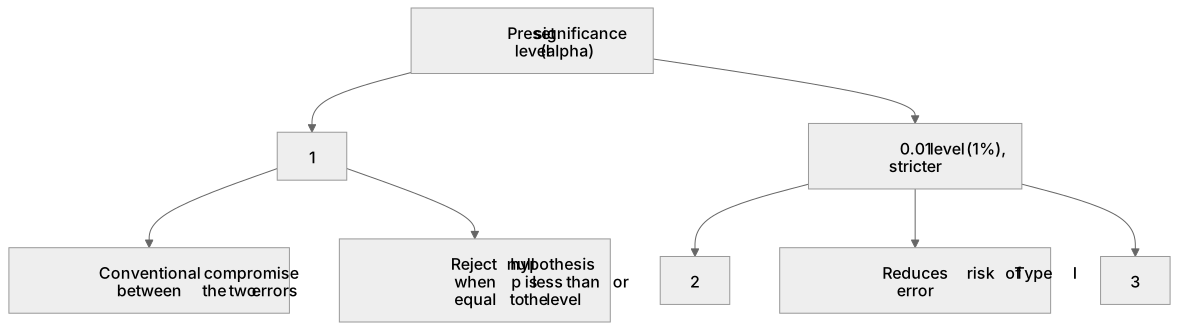
1Box 1
2Box 2
3Box 3
There is more to this lesson
The full lesson goes on to check your understanding and help you earn the marks. Create a free account to carry on, with your progress saved.
A week of Premium from your first lesson · Then the free plan continues · No card, no charge
Test your understanding of D.1 – handling data: Understand simple probability (to include: explaining the difference between the 0.05 and 0.01 levels of significance)
Active recall beats re-reading. Take an instant quiz now to test what you’ve learned and lock it into long-term memory.
A week of Premium from your first lesson · Then the free plan continues · No card, no charge