Photosynthesis — OCR GCSE Biology
Photosynthesis explained
Photosynthesis covers 16 specification points, including Understand and use simple compound measures… and Translate information between graphical and….
Read the full explanation
Open a point below for its explanation and revision guidance.
understand and use simple compound measures such as the rate of a reaction
In photosynthesis investigations, reaction rate is quantified using compound measures that reflect the volume of oxygen gas produced or volume of carbon dioxide absorbed per unit of time. For instance, measuring 12 cm³ of oxygen collected in a gas syringe over a duration of 4 minutes gives a compound rate of 3 cm³ min⁻¹ (or 0.05 cm³ s⁻¹). Alternatively, when counting bubbles produced by aquatic pondweed, rate is expressed as bubbles min⁻¹. Using compound measures allows scientists to standardize results across different trials and compare photosynthetic rates under varying conditions.
translate information between graphical and numerical form
Photosynthesis questions require students to translate information between numerical data tables and graphical representations. This includes converting raw experimental readings into coordinates, plotting points accurately on a grid, and reading corresponding values from curves. For instance, determining the light intensity at which the photosynthetic rate reaches its plateau requires reading the x-coordinate where the curve becomes horizontal. Similarly, extracting numerical rates at specific temperatures enables students to calculate rate ratios or percentage differences across experimental conditions.
plot and draw appropriate graphs, selecting appropriate scales and axes
Constructing biological graphs requires systematic selection of scales and axes. The independent variable, such as lamp distance, light intensity, or temperature, is plotted on the horizontal x-axis, while the dependent variable, such as volume of oxygen evolved per minute, is plotted on the vertical y-axis. Linear, regular scales must be chosen so that plotted points occupy at least half the available grid space in both dimensions. Plotted points must be positioned precisely within half a small square, followed by drawing a smooth, continuous line of best fit or curve that reflects the biological trend.
extract and interpret information from graphs, charts and tables
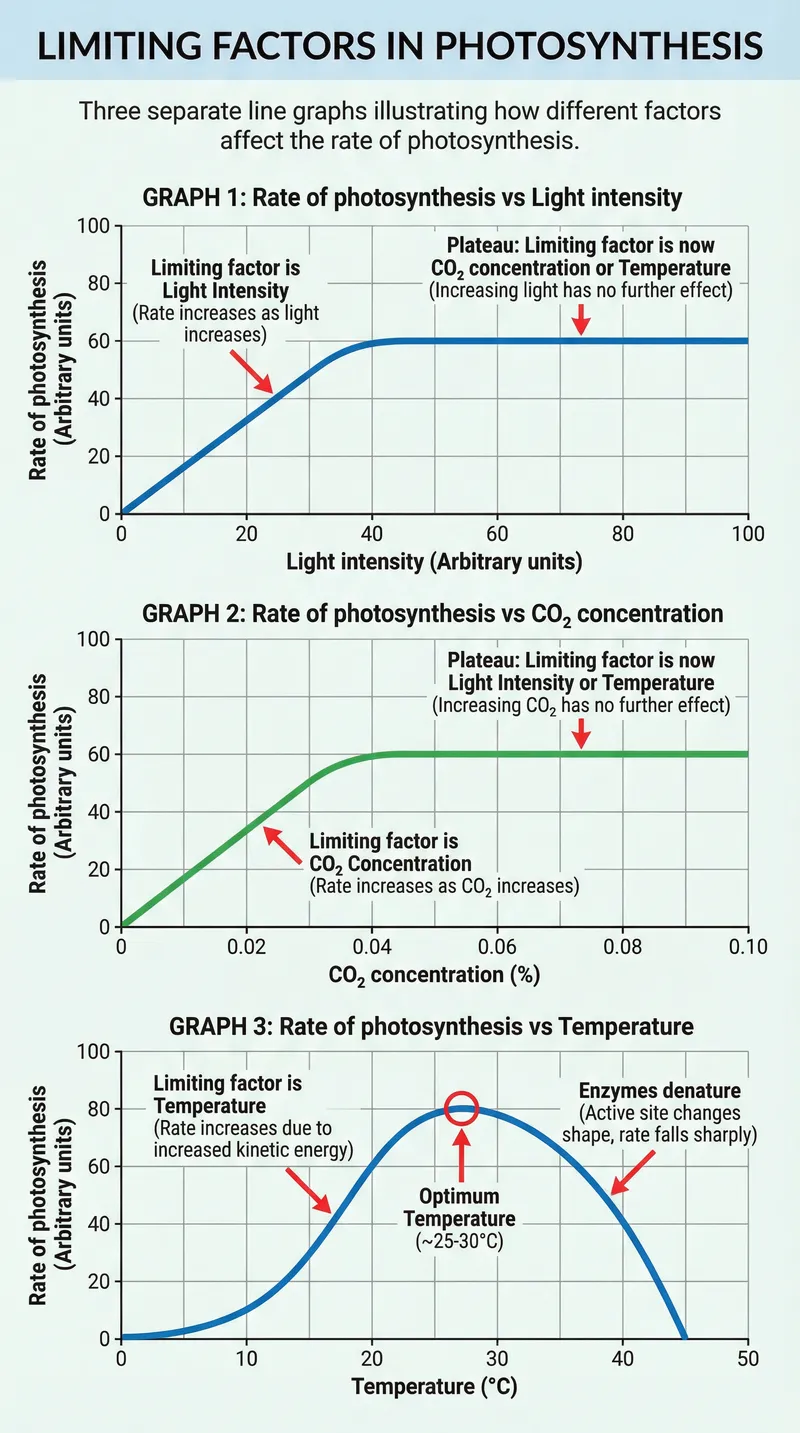
Interpreting photosynthesis data involves analyzing trends and identifying limiting factors from charts and graphs. When plotting photosynthetic rate against an environmental factor such as light intensity or carbon dioxide concentration, the graph displays two distinct zones. On the initial steep upward slope, rate increases proportionally, demonstrating that the factor on the x-axis is limiting the reaction. When the curve flattens into a horizontal plateau, rate remains constant despite further increases, indicating that a different factor, such as temperature or enzyme availability, has become limiting.
understand and use inverse proportion – the inverse square law and light intensity in the context of factors affecting photosynthesis (Higher tier only)
Light intensity from a small lamp spreads over a sphere, so intensity is inversely proportional to distance squared: intensity ∝ 1 / d². Doubling the distance (e.g. 10 cm to 20 cm) gives 1 / 2² = 1/4, so intensity falls to one quarter; tripling gives 1 / 3² = 1/9. This is inverse proportion, not inverse linear: doubling distance does not halve intensity. In pondweed experiments, count oxygen bubbles per minute at several distances, then plot rate against 1 / d² to give a straight line through the origin, showing rate is proportional to light intensity when light is limiting. Relative intensity is a ratio, so it is dimensionless or given in arbitrary units, never cm⁻².
describe photosynthetic organisms as the main producers of food and therefore biomass for life on Earth
Photosynthetic organisms, including terrestrial green plants, freshwater algae, and marine phytoplankton, function as autotrophic producers. By harnessing solar radiant energy, they convert inorganic carbon dioxide and water into energy-rich glucose sugar. Plants convert this synthesized glucose into complex organic macromolecules including starch, cellulose, lipids, and proteins, which form new biological tissues termed biomass. Because heterotrophic animals cannot synthesize organic compounds from inorganic precursors, photosynthetic biomass forms the energetic base (trophic level 1) of nearly all ecosystems.
describe the process of photosynthesis (to include: reactants and products, two-stage process, location of the reaction (in the chloroplasts))
Photosynthesis takes place within chloroplasts, sub-cellular organelles containing the light-trapping green pigment chlorophyll. The overall chemical reaction requires carbon dioxide and water as reactants, producing glucose and oxygen gas: 6CO₂ + 6H₂O → C₆H₁₂O₆ + 6O₂. Photosynthesis occurs in two main stages. In the first light-dependent stage, light energy absorbed by chlorophyll splits water molecules (photolysis), releasing oxygen gas as a byproduct while generating ATP and hydrogen. In the second light-independent stage, this energy and hydrogen are used to reduce carbon dioxide into glucose molecules.
describe photosynthesis as an endothermic reaction
Photosynthesis is categorized chemically as an endothermic reaction because it absorbs energy from its environmental surroundings. Radiant light energy emitted by the Sun is captured by chlorophyll pigments within chloroplasts and converted into stored chemical energy. The total quantity of energy required to break the chemical bonds in the reactant molecules (carbon dioxide and water) is greater than the energy released during the formation of new bonds in the products (glucose and oxygen). This absorbed energy is locked within the chemical bonds of glucose, establishing the energetic foundation for ecosystems.
describe experiments to investigate photosynthesis
Photosynthesis investigations commonly use aquatic plants such as Elodea or Cabomba submerged in a beaker of water containing sodium hydrogencarbonate, which supplies a continuous concentration of dissolved carbon dioxide. When illuminated, oxygen gas released from the cut stem is quantified by counting bubbles produced per minute or collecting gas in an inverted measuring cylinder or gas syringe. Environmental factors are systematically varied: lamp distance tests light intensity, water baths alter temperature, and varying bicarbonate concentrations tests carbon dioxide availability.
explain the effect of temperature, light intensity and carbon dioxide concentration on the rate of photosynthesis
Three environmental factors directly govern photosynthetic rate. Increasing light intensity supplies more radiant energy to excite electrons in chlorophyll, raising rate proportionally until another factor limits. Increasing carbon dioxide concentration provides more carbon substrate for fixation into glucose, linearly accelerating rate until saturation. Temperature affects the kinetic energy of photosynthetic enzymes: as temperature rises toward the optimum, enzyme-substrate collision frequency increases; above optimum (typically around 40 °C), thermal agitation breaks hydrogen bonds, denaturing enzyme active sites.
[Higher tier only: explain the interaction of temperature, light intensity and carbon dioxide concentration in limiting the rate of photosynthesis] (to include: using graphs depicting the effects of the limiting factors)
The principle of limiting factors states that the rate of a process is determined by the factor in shortest supply. For photosynthesis, these are light intensity, CO₂ concentration, and temperature. On a graph of rate vs. light intensity, the initial rising slope shows light is the limiting factor; more light means a faster rate. When the graph plateaus, the rate is constant because another factor is now limiting it. For example, a curve for a plant at a low CO₂ concentration will plateau at a lower rate than a plant at a high CO₂ concentration, even with abundant light. Similarly, increasing temperature can raise the plateau, but only up to an optimum, after which enzymes may denature. Commercial growers use this knowledge in glasshouses, providing artificial light, heating, and CO₂ to maximise the rate of photosynthesis and increase crop yield.
Use of appropriate apparatus and techniques for the observation and measurement of biological changes and/or processes
Photosynthesis investigations measure the rate of oxygen evolution from aquatic plants (such as Cabomba or Elodea) under varying environmental conditions. A freshly cut stem of pondweed is placed upside down in a boiling tube filled with dilute sodium hydrogen carbonate solution, which supplies an excess of dissolved carbon dioxide. The apparatus is allowed to equilibrate for 5 minutes under a light source before observations begin. As photosynthesis occurs, bubbles of oxygen gas emerge from the cut stem. Alternatively, starch production in terrestrial leaves is tested by boiling a leaf in water, decolorizing it in hot ethanol, and staining with iodine solution on a white tile to observe starch distribution.
Safe and ethical use of living organisms (plants or animals) to measure physiological functions and responses to the environment
Investigating physiological processes in living plants requires careful handling to preserve tissue viability and obtain valid data. Aquatic plants like Cabomba must be kept submerged in pond water or nutrient solutions to prevent desiccation of delicate photosynthetic fronds. When positioning high-intensity lamps near plants, thermal damage must be prevented: traditional incandescent bulbs radiate significant heat, which raises water temperature and alters enzyme activity. To isolate light intensity as the sole independent variable, investigators place a transparent heat shield (such as a flat-sided beaker of water) between the lamp and boiling tube, or use cool LED lighting, and return plants safely to aquaria.
Measurement of rates of reaction by a variety of methods including production of gas, uptake of water and colour change of indicator
Photosynthetic rates can be quantified using bubble counting, volumetric gas collection, water uptake, or indicator colorimetry. Counting bubbles released per minute from pondweed is simple but error-prone because bubble volume varies and rapid bubbling is hard to count accurately. A photosynthometer or inverted microburette collects oxygen into a capillary tube, where the length of the gas bubble is measured with a millimetre ruler or syringe to calculate exact volume. Uptake of water can be measured with an aquatic potometer: as photosynthesis proceeds, water is drawn along a capillary and the meniscus movement per minute is recorded as a rate. Alternatively, hydrogencarbonate indicator enclosing pondweed or immobilised algae balls changes from red to purple as carbon dioxide is absorbed, providing a colorimetric measure of photosynthetic rate.
Safe use of appropriate heating devices and techniques including use of a Bunsen burner and a water bath or electric heater
Testing a leaf for starch requires heating steps that carry significant chemical fire hazards. The leaf is first immersed in boiling water for 1 minute using a Bunsen burner, tripod, and wire gauze to soften cuticle wax, rupture cell membranes, and denature enzymes. The leaf is then placed into a boiling tube containing ethanol to extract green chlorophyll. Because ethanol is highly flammable, the Bunsen burner MUST be turned off completely before placing the tube of ethanol into the beaker of hot water, or an electric thermostatically controlled water bath must be used. Wearing eye protection, handling tubes with tongs, and avoiding all open flames near ethanol vapors ensures laboratory safety.
Use of appropriate apparatus to make and record a range of measurements accurately, including length, area, mass, time, temperature, volume of liquids and gases, and pH
Investigating the relationship between light intensity and photosynthesis requires accurate physical measurements. Distance (d) from the light source to the plant is measured in metres using a metre ruler. Light intensity follows the inverse square law, calculated as relative light intensity proportional to 1 / d². Gas volume is collected in a calibrated capillary tube or gas syringe readable to 0.05 cm³, or bubble length is measured with a millimetre ruler. A digital stopwatch records time in minutes. Water temperature is measured with a digital thermometer to confirm consistency across runs. Sodium hydrogen carbonate solution is measured using a graduated cylinder to maintain identical chemical environments.
Watch and listen
Visual Resources
1 diagram and illustration
Interactive Diagrams
1 interactive diagram to visualise key concepts
Conceptual Flow Outline
A concept map showing the inputs and outputs of photosynthesis and the uses of glucose.
Your focus
- Calculate photosynthetic rate from oxygen volume and time measurements.
- Assign correct compound units such as cm³ min⁻¹ and bubbles min⁻¹.
- Compare photosynthetic rates quantitatively across varying conditions.
Show all 48 objectives
- Extract numerical data from photosynthesis graphs accurately.
- Translate numerical tables of photosynthesis rates into graphical coordinates.
- Use extracted values to calculate rates and percentage changes.
- Assign independent and dependent variables to correct axes with units.
- Select linear, sensible scales occupying at least 50% of the grid.
- Plot data points accurately and draw appropriate lines or curves of best fit.
- Identify limiting factors from the slopes and plateaus of photosynthesis graphs.
- Extract numerical data from charts and tables to substantiate biological claims.
- Explain why rate plateaus despite further increases in the independent variable.
- Explain the inverse square law relating light intensity and distance.
- Calculate relative light intensity using the formula 1 / d².
- Predict quantitative changes in photosynthetic rate when lamp distance is varied.
- Describe photosynthetic organisms as primary producers converting light into chemical energy.
- Explain how synthesized glucose is converted into biomass.
- Evaluate the fundamental role of producers at trophic level 1 of ecosystems.
- Identify chloroplasts and chlorophyll as the location of photosynthetic reactions.
- State the reactants, products, and balanced chemical equation for photosynthesis.
- Describe the two stages of photosynthesis: water splitting and carbon fixation.
- Classify photosynthesis as an endothermic chemical reaction.
- Explain how radiant energy is absorbed by chlorophyll during photosynthesis.
- Compare energy changes in photosynthesis with exothermic cellular respiration.
- Describe the standard experimental procedure using pondweed to measure photosynthetic rate.
- Explain how to systematically alter light, temperature, and carbon dioxide.
- Identify control variables to ensure validity when testing limiting factors.
- Explain the effect of light intensity on photosynthesis rate and limiting factor plateaus.
- Explain how carbon dioxide concentration limits the synthesis of glucose.
- Describe the temperature curve of photosynthesis in terms of kinetic collisions and enzyme denaturation.
- Explain how temperature, light intensity and CO₂ interact as limiting factors for photosynthesis.
- Interpret multi-line graphs showing the interaction of limiting factors.
- Apply limiting factor principles to explain how to optimise crop yields in commercial greenhouses.
- Set up aquatic pondweed apparatus correctly with sodium hydrogen carbonate solution to measure oxygen release.
- Explain the necessity of providing an equilibration period when changing environmental variables in photosynthesis assays.
- Demonstrate starch production in illuminated leaves using sequential water boiling, ethanol extraction, and iodine staining.
- Handle living aquatic plants ethically and carefully to maintain physiological viability throughout experiments.
- Explain how heat shields and LED light sources prevent thermal stress and isolate light intensity as the independent variable.
- Evaluate experimental setups to eliminate temperature confounding factors in photosynthesis rate measurements.
- Measure photosynthetic rate using bubble counting, capillary microburettes, water-uptake potometry, and hydrogencarbonate indicator solutions.
- Critique the validity and precision of bubble counting compared to volumetric gas measurement apparatus.
- Interpret colour changes in hydrogencarbonate indicator to determine relative rates of photosynthesis and respiration.
- Execute the leaf starch test following safe heating protocols for flammable organic solvents.
- Explain the biological purpose of each step: boiling water (killing), hot ethanol (decolorizing), warm water (softening).
- Identify fire hazards associated with ethanol vapors and implement electric water bath or extinguished-flame safety measures.
- Measure light source distance accurately and apply the inverse square law (1 / d²) to determine relative light intensity.
- Record gas volumes and observation times using precision syringes, capillary tubes, and digital stopwatches.
- Analyze graphical data showing the relationship between light intensity, distance, and photosynthetic rate.
Photosynthesis exam tips
Marking Points
- calculating photosynthetic rate as volume of oxygen produced divided by time taken
- expressing rate with appropriate compound units such as cm³ min⁻¹ or cm³ s⁻¹
- using compound rates to compare photosynthetic efficiency under different conditions
- extracting coordinates accurately from photosynthesis rate curves
- translating tabular values into plotted points on a coordinate grid
- calculating numerical differences or percentage changes between data extracted from graphs
- placing the independent variable on the x-axis and dependent variable on the y-axis with full labels and units
- choosing linear scales where plotted data occupies more than 50% of the graph grid
- plotting all points accurately within half a small grid square
- drawing a single, smooth line or curve of best fit without feathery lines or point-to-point joins
- identifying that on the steep rising part of the graph the factor on the x-axis is the limiting factor
- identifying that on the plateau region a factor other than the one on the x-axis is limiting rate
- extracting and comparing quantitative values from tables and curves to support biological conclusions
- Stating the inverse square law as light intensity being proportional to 1 / d², and distinguishing inverse proportion from inverse linear proportion.
- Calculating that doubling distance decreases light intensity by a factor of 4 (to one quarter) and tripling by a factor of 9.
- Calculating relative light intensity values using 1 / distance², recognising the result is a dimensionless ratio or in arbitrary units, not cm⁻².
- Explaining that plotting photosynthetic rate against 1 / d² gives a straight line through the origin when light intensity is the limiting factor.
- Using bubble counts or oxygen volume per unit time as a measure of photosynthetic rate at each lamp distance.
- defining photosynthetic organisms as autotrophic producers that synthesize organic molecules from CO₂ and H₂O
- stating that synthesized glucose is converted into biological macromolecules to generate biomass
- explaining that plant biomass provides the foundation and primary food source for higher trophic levels
- identifying chloroplasts as the cellular site of photosynthesis containing chlorophyll
- stating the reactants as carbon dioxide and water, and products as glucose and oxygen
- describing the first stage where light splits water molecules releasing oxygen gas
- describing the second stage where carbon dioxide is combined with hydrogen to synthesize glucose
- classifying photosynthesis as an endothermic reaction
- explaining that photosynthesis absorbs light energy from the surroundings via chlorophyll
- stating that energy required to break bonds in CO₂ and H₂O exceeds energy released forming products
- using an aquatic plant like pondweed in sodium hydrogencarbonate solution to supply carbon dioxide
- measuring photosynthetic rate by counting oxygen bubbles per minute or measuring gas volume in a syringe
- varying an independent variable such as lamp distance, water temperature, or bicarbonate concentration
- controlling variables such as water bath temperature or using an LED bulb to prevent heat transfer
- explaining that increasing light intensity provides more energy to excite chlorophyll until another factor limits
- explaining that increasing CO₂ concentration increases substrate available for carbon fixation until saturation
- explaining that increasing temperature increases kinetic energy and collision frequency between enzymes and substrates
- stating that temperatures exceeding the optimum cause enzymes to denature, permanently halting photosynthesis
- Explaining the principle of limiting factors: the factor at the lowest or least favourable value restricts the overall rate.
- Identifying that on the rising slope of a rate–light intensity graph, light intensity is the factor limiting the rate.
- Explaining that when a light curve plateaus, another factor such as CO₂ concentration or temperature has become limiting.
- Comparing two curves on the same axes to deduce which factor (e.g. higher temperature or CO₂) caused a difference in plateau height.
- Explaining commercial greenhouse applications where heat, artificial light and CO₂ are optimised to maximise yield.
- Submerge freshly cut pondweed stem upwards in dilute sodium hydrogen carbonate solution to ensure carbon dioxide is not a limiting factor.
- Allow the plant an equilibration period (e.g. 5 minutes) at each new light intensity or distance before collecting data.
- Observe and count oxygen bubbles released from the cut stem or collect gas over a specified observation period (e.g. 1 minute).
- Test terrestrial leaves for starch by boiling in water, extracting chlorophyll in hot ethanol, and staining with iodine solution.
- Keep aquatic plants fully submerged in suitable aquatic medium to prevent tissue desiccation and damage to cellular structures.
- Use an LED lamp or place a transparent water heat shield between the lamp and plant to prevent heat from affecting the rate.
- Handle plant stems gently and make clean diagonal cuts with a sharp blade to preserve vascular transport tissue.
- Maintain environmental stability to avoid heat stress, ensuring light intensity is the only manipulated variable.
- Count oxygen bubbles produced per minute as a direct, simple measure of photosynthetic rate.
- Collect oxygen gas in a microburette or capillary photosynthometer and measure bubble length or volume to improve measurement accuracy.
- Measure uptake of water using an aquatic potometer, recording meniscus movement per minute as a rate of photosynthesis.
- Use hydrogencarbonate indicator to monitor carbon dioxide consumption, tracking colour shift from red (neutral) to purple (alkaline).
- Compare the limitations of bubble counting (variable bubble volume, human counting error) against volumetric gas measurement and potometry.
- Boil the leaf in water to soften the cuticle, rupture cell membranes, and stop metabolic enzyme activity.
- Place the leaf in a boiling tube of ethanol to dissolve and extract chlorophyll so that subsequent color changes are clearly visible.
- Extinguish all Bunsen burner flames before placing ethanol tubes into hot water, or use an electric water bath to eliminate fire risk.
- Wear eye protection and use forceps to retrieve the brittle decolorized leaf before rinsing in warm water to soften.
- Measure distances between light source and plant accurately using a metre ruler placed at bench level.
- Calculate relative light intensity using the inverse square law: light intensity is proportional to 1 / (distance squared).
- Measure oxygen gas volume using a calibrated capillary tube or gas syringe rather than relying on bubble count.
- Record observation durations using a digital stopwatch and monitor water temperature with a thermometer to confirm control.
Examiner Tips
- 💡Look at the unit on the answer line: if it asks for cm³ min⁻¹, divide volume by minutes; if cm³ s⁻¹, divide by seconds.
- 💡Always show working clearly: Rate = Volume / Time.
- 💡Draw construction lines with a pencil and ruler directly on the graph to ensure accurate coordinate readings.
- 💡Check axis labels and units carefully before reading numerical values.
- 💡Ensure scales use simple step intervals such as 1, 2, 5, or 10 rather than awkward intervals like 3 or 7.
- 💡Use neat small crosses (x) to plot points rather than large messy dots.
- 💡Divide the curve into two sections: rising slope where x is limiting, and plateau where another factor limits.
- 💡Quote specific data pairs (with units) from the graph when asked to describe or interpret the observed trend.
- 💡Remember: distance × 2 means intensity ÷ 4; distance × 3 means intensity ÷ 9.
- 💡Show your working clearly: calculate d² first, then take the reciprocal 1 / d², and state that the value is relative or in arbitrary units.
- 💡Use the term biomass explicitly to mean the mass of biological material synthesized by organisms.
- 💡Emphasize that all food chains rely on producers capturing solar energy to support life on Earth.
- 💡Be prepared to write both the balanced symbol equation (6CO₂ + 6H₂O → C₆H₁₂O₆ + 6O₂) and word equation.
- 💡Remember the two stages: light-dependent photolysis of water, followed by carbon dioxide fixation into glucose.
- 💡Clearly state that photosynthesis takes in light energy, making it an endothermic process.
- 💡Link endothermic reactions to chemical energy storage in the chemical bonds of the synthesized glucose.
- 💡Always mention sodium hydrogencarbonate solution and explain that its purpose is to provide excess carbon dioxide.
- 💡Specify using an LED lamp or placing a glass heat shield between the lamp and beaker to keep temperature constant.
- 💡Explain each factor in terms of biological mechanism: energy for light, substrate for CO₂, and enzyme kinetics for temperature.
- 💡When describing temperature curves, distinguish between the rising kinetic slope and the steep denaturation drop.
- 💡To identify what limits the rate at the plateau on a graph, look at what has been changed between the different curves (e.g. higher CO₂ or temperature).
- 💡Apply limiting factors to commercial agriculture: growers may burn paraffin heaters to supply both heat and carbon dioxide in glasshouses, increasing yield and profit.
- 💡Always explain the purpose of sodium hydrogen carbonate in photosynthesis investigations: it provides a constant source of dissolved carbon dioxide.
- 💡Remember that the leaf starch test proves photosynthesis occurred over hours or days, whereas pondweed bubbling measures instantaneous photosynthetic rate.
- 💡Whenever an exam question shows a lamp placed close to pondweed, look for a beaker of water or heat screen and explain that it controls temperature.
- 💡If asked to improve a photosynthesis experiment using a filament bulb, suggest replacing it with an LED bulb because LEDs emit minimal heat.
- 💡In evaluation questions, explain that a photosynthometer or gas syringe is superior to bubble counting because it measures actual volume.
- 💡Remember the colour shifts of hydrogencarbonate indicator: yellow in high CO2 (respiration), red at atmospheric CO2, and purple in low CO2 (photosynthesis).
- 💡Examiners frequently ask for the specific safety precaution when extracting chlorophyll: state 'turn off the Bunsen burner before using ethanol'.
- 💡Know the four-step sequence for the starch test: boil in water (kills leaf), boil in ethanol in water bath (removes chlorophyll), dip in warm water (softens), add iodine.
- 💡Practise calculating light intensity using 1 / d²; for example, doubling distance from 10 cm to 20 cm reduces light intensity by a factor of 4.
- 💡When plotting graphs of photosynthesis rate, put distance or 1 / d² on the x-axis and rate of bubble production or gas volume on the y-axis.
Common Mistakes
- expressing rate as a raw volume (cm³) without incorporating the time component
- failing to convert time when the question requires rate in per second rather than per minute
- misreading graph scales, such as misinterpreting five small squares representing 10 units as single units
- reading values from the wrong curve when multiple curves (e.g. at differing CO₂ levels) are plotted on one set of axes
- swapping axes, placing the dependent variable on the x-axis instead of the y-axis
- drawing a jagged point-to-point line rather than a smooth curve of best fit
- forcing a best-fit line through the origin when the biological data does not begin at zero
- claiming the reaction has stopped when the graph line becomes horizontal, rather than recognizing it continues at a constant maximum rate
- attributing a plateau to the factor on the x-axis running out rather than a different environmental factor becoming limiting
- Assuming an inverse linear relationship, believing that doubling distance halves the light intensity; correction: intensity falls by the square of the distance factor, so doubling distance gives one quarter.
- Forgetting to square the distance value before taking the reciprocal; correction: calculate d² first, then 1 / d².
- Attaching units such as cm⁻² to relative light intensity; correction: 1 / d² is a ratio and is dimensionless or expressed in arbitrary units.
- thinking plants obtain food or biomass from the soil rather than synthesizing it via photosynthesis
- confusing producers (autotrophs) with consumers or decomposers in food chains
- confusing reactants and products, writing oxygen and glucose on the reactant side
- omitting the role of chlorophyll in absorbing light energy within the chloroplasts
- confusing endothermic (absorbs energy, photosynthesis) with exothermic (releases energy, respiration)
- stating that photosynthesis produces heat or warms the surroundings, misunderstanding energy absorption
- using a filament bulb without a heat shield or water bath, causing temperature to confound light intensity tests
- assuming bubbles are pure oxygen, forgetting they contain dissolved air and nitrogen gas, though bubble rate reflects oxygen production
- stating that rate continues to rise indefinitely with increasing light intensity, ignoring plateaus caused by other limiting factors
- saying high temperatures kill the plant rather than specifically explaining that photosynthetic enzymes denature
- Failing to compare two different curves on the same axes to deduce which factor caused the plateau; correction: identify what changes between the curves, such as higher CO₂ or temperature, to explain the different maximum rates.
- Assuming light is always the limiting factor, ignoring that in bright conditions either temperature or CO₂ concentration is usually limiting; correction: at high light intensity the plateau shows another factor is limiting the rate.
- Treating the plateau as evidence that photosynthesis has stopped; correction: the rate is constant because another factor is limiting, not because photosynthesis has ceased.
- Using boiled or deoxygenated plain water instead of sodium hydrogen carbonate solution, leaving carbon dioxide as a limiting factor.
- Failing to allow an equilibration period after changing conditions, recording transitional rates rather than steady-state photosynthesis.
- Crushing the cut end of the pondweed stem with scissors or blunt blades, which blocks the vascular bundles and stops bubble release.
- Using hot incandescent lamps without a heat screen, causing temperature to rise and acting as an uncontrolled confounding variable.
- Leaving aquatic plants out of water during setup, causing fronds to dry out and halting photosynthetic gas exchange.
- Cutting stems with blunt scissors that crush xylem and air spaces, preventing regular bubble release.
- Assuming all bubbles produced by pondweed are equal in volume, leading to inaccurate rate estimations.
- Believing bubbles released by pondweed consist purely of oxygen, forgetting they contain dissolved nitrogen and air from intercellular spaces.
- Failing to seal capillary apparatus, photosynthometers, or potometers, allowing gas or water leaks that lead to underestimated volumes or meniscus movement.
- Confusing the direction of meniscus movement in a potometer with gas production, rather than treating it as a measure of water uptake.
- Heating ethanol in a boiling tube directly over an open Bunsen flame, creating an extreme flash fire hazard.
- Skipping the water rinse after ethanol extraction, leaving the leaf brittle and prone to tearing when adding iodine.
- Testing for starch without first extracting chlorophyll, making the blue-black color change impossible to see against green tissue.
- Assuming that doubling the distance from the lamp halves the light intensity, forgetting the inverse square law relationship.
- Measuring distance from the lamp bulb to the edge of the bench rather than to the plant stem in the tube.
- Ignoring temperature changes between close and distant lamp positions, introducing a major uncontrolled variable.